

2026
Q3 2026
R472 — 2026-09-08
- Intercom integration removed — the in-app Intercom messenger is gone from the product, retiring the embedded help and messaging widget.
R471 — 2026-08-31
- Dashboard-aware report search in Lumos — searching for reports from a dashboard prompt now takes the dashboard into account when generating a response.
- Fixed-height Date Widget — the date widget no longer changes height with its contents.
R470 — 2026-08-25
- Report CSV export rewritten — export is rebuilt around a shared cell contract and a per-report table view, so the CSV matches what the report actually renders.
- CSV row limit raised from 500 to 2,500 — five times as many rows per export.
R469 — 2026-08-18
- Cohort exclusion (NOT IN) — filter to subjects who are not in a cohort, via a new exclusion toggle on the cohort filter.
- Revision versions in the panel — revision versions are shown, and the panel refreshes when a report is renamed.
R466 — 2026-07-29
- MCP tool call tracing — tool call inputs and outcomes are traced, making it possible to see what an AI client asked for and what it got back.
R464 — 2026-07-15
- Hide "Total" group when a breakdown is applied in Query — the aggregate
Totalseries no longer competes with the breakdown groups on the chart.
R462 — 2026-07-01
- Report Revisions — reports keep a revision history, with lineage backfilled for existing reports.
- User-defined report names preserved — a name you set survives new revisions, while auto-generated names are regenerated; auto-generated names also drop the time-unit prefix.
- New User notification on SSO login — the notification fires when a user first logs in through SSO, not only on explicit invitation.
- Filter "ignore case" honored for the EQUAL operator — the toggle no longer produces case-sensitive SQL.
Q2 2026
R459 — 2026-06-10
- "Show Disabled" toggle for Events and Data Modeler fields — reveal disabled events and fields instead of having them hidden entirely.
R458 — 2026-06-03
- Scatter chart — a new Query visualization plotting measures against each other, with measure names on the axes, a three-measure cap and color that persists across saves.
- Heatmap chart — a new visualization with measure roles, a measure cap, an empty state and persistent color.
- Lumos out of Beta — Beta labelling removed from Lumos throughout the product.
R456 — 2026-05-20
- Sorting in Funnel and Retention chart settings — sort funnel results, including by average value.
- Time to Convert conversion window defaults — switching a funnel to Time to Convert applies the TTC default conversion window and resets partitions, with TTC partitioned by session and conversion window.
- "Shared with me" in the Add to Dashboard picker — reports can be added to dashboards shared with you, not only your own.
- Data Table sort persists across save — a sorted Data Table reopens sorted.
- Deep link to a cohort's inspect view — link straight to Inspect for a cohort.
R455 — 2026-05-13
- Cohort workflow improvements — clearer cohort modes, corrected execution on modified saved cohorts, and a restructured description, with modal sizing, save tooltips and inspect identity tightened up.
- Chart resets when leaving All Time — switching away from an All Time range returns the chart to its regular view rather than keeping the All Time rendering.
R452 — 2026-04-23
- Search term no longer persists across schemas in Data Modeler — browsing to another schema or table clears the previous search query.
- Higher field value limit for nested property keys — the cap on field value count is relaxed for Nested Property keys and for the download field template.
Q1 2026
R448 — 2026-03-25
- Sunday week start on Databricks — week boundaries can start on Sunday for Databricks-backed schemas.
R446 — 2026-03-10
- AI Readiness covers Cohorts — cohorts join events, fields, measures and virtual events in the AI Readiness score, with compound cohorts resolving their simple cohorts.
- Duplicate measures blocked in Data Table — adding the same measure twice no longer produces a SQL error.
R445 — 2026-03-04
- AI Readiness covers Measures and Virtual Events — both are scored and carry the AI Readiness chip, with managed tags applying correctly to versioned events.
- Path analysis removed — Path is retired from the product, completing the migration to Flow begun in R440.
- AI generation hidden without an AI integration — the generate buttons are hidden for customers who do not have AI enabled.
- Lumos memory — the memory control returns to the agent page.
R444 — 2026-02-23
- Ingested metadata indicators in the Dictionary — events and fields synced from your warehouse show a sync status, and their descriptions and tags become read-only so the source of truth is preserved.
- Breakdown fields on the Dictionary Fields page — breakdown fields are listed and counted toward the AI Readiness total.
R443 — 2026-02-19
- AI Readiness chip — a progress chip tracks how much of your catalog carries the descriptions and tags AI features depend on, with completed chapters collapsible.
- AI-suggested descriptions and tags — suggestions are generated in batches so large catalogs no longer time out, with newly generated descriptions assigned a lower quality until the model evaluates them.
- AI-generated field synonyms — alternate names are generated for fields to improve natural-language matching.
- Right panel closed by default — reports open with the right panel collapsed.
R442 — 2026-02-10
- Path to Flow migration — Path interactions are disabled and Flow drops its Beta flag; a Path report's configuration, including merged and folded events, copies into a Flow report through next steps. Path reports can no longer be favorited or added to dashboards.
- Dictionary redesign — the Dictionary gains two modes, a footer summarizing pending updates, and reworked tables, tags and search.
- Lumos conversation controls — conversations can be renamed and deleted, an in-flight message can be cancelled, and message ordering is stable.
R440 — 2026-01-30
- Lumos conversation persistence — conversations and their state survive across sessions, with recent report search, reuse of cached report results instead of re-running them, and suggested next steps.
- Report Builder redesign — reworked funnel steps, measure builder, filter and group-by sections, and mode button grid, on a new design system with updated typography and color tokens.
- Table export across pages — export a table to file from the pages that show one.
- Sticky report header — the report header stays visible while scrolling.
- Dashboards auto-scroll on filter click — clicking a filter scrolls the dashboard to the affected content.
R439 — 2026-01-23
📊 Multiple Formulas in Query Reports
Build sophisticated calculations without the workarounds. You can now create up to 3 Formulas in Query Reports, combining your measures in powerful ways.
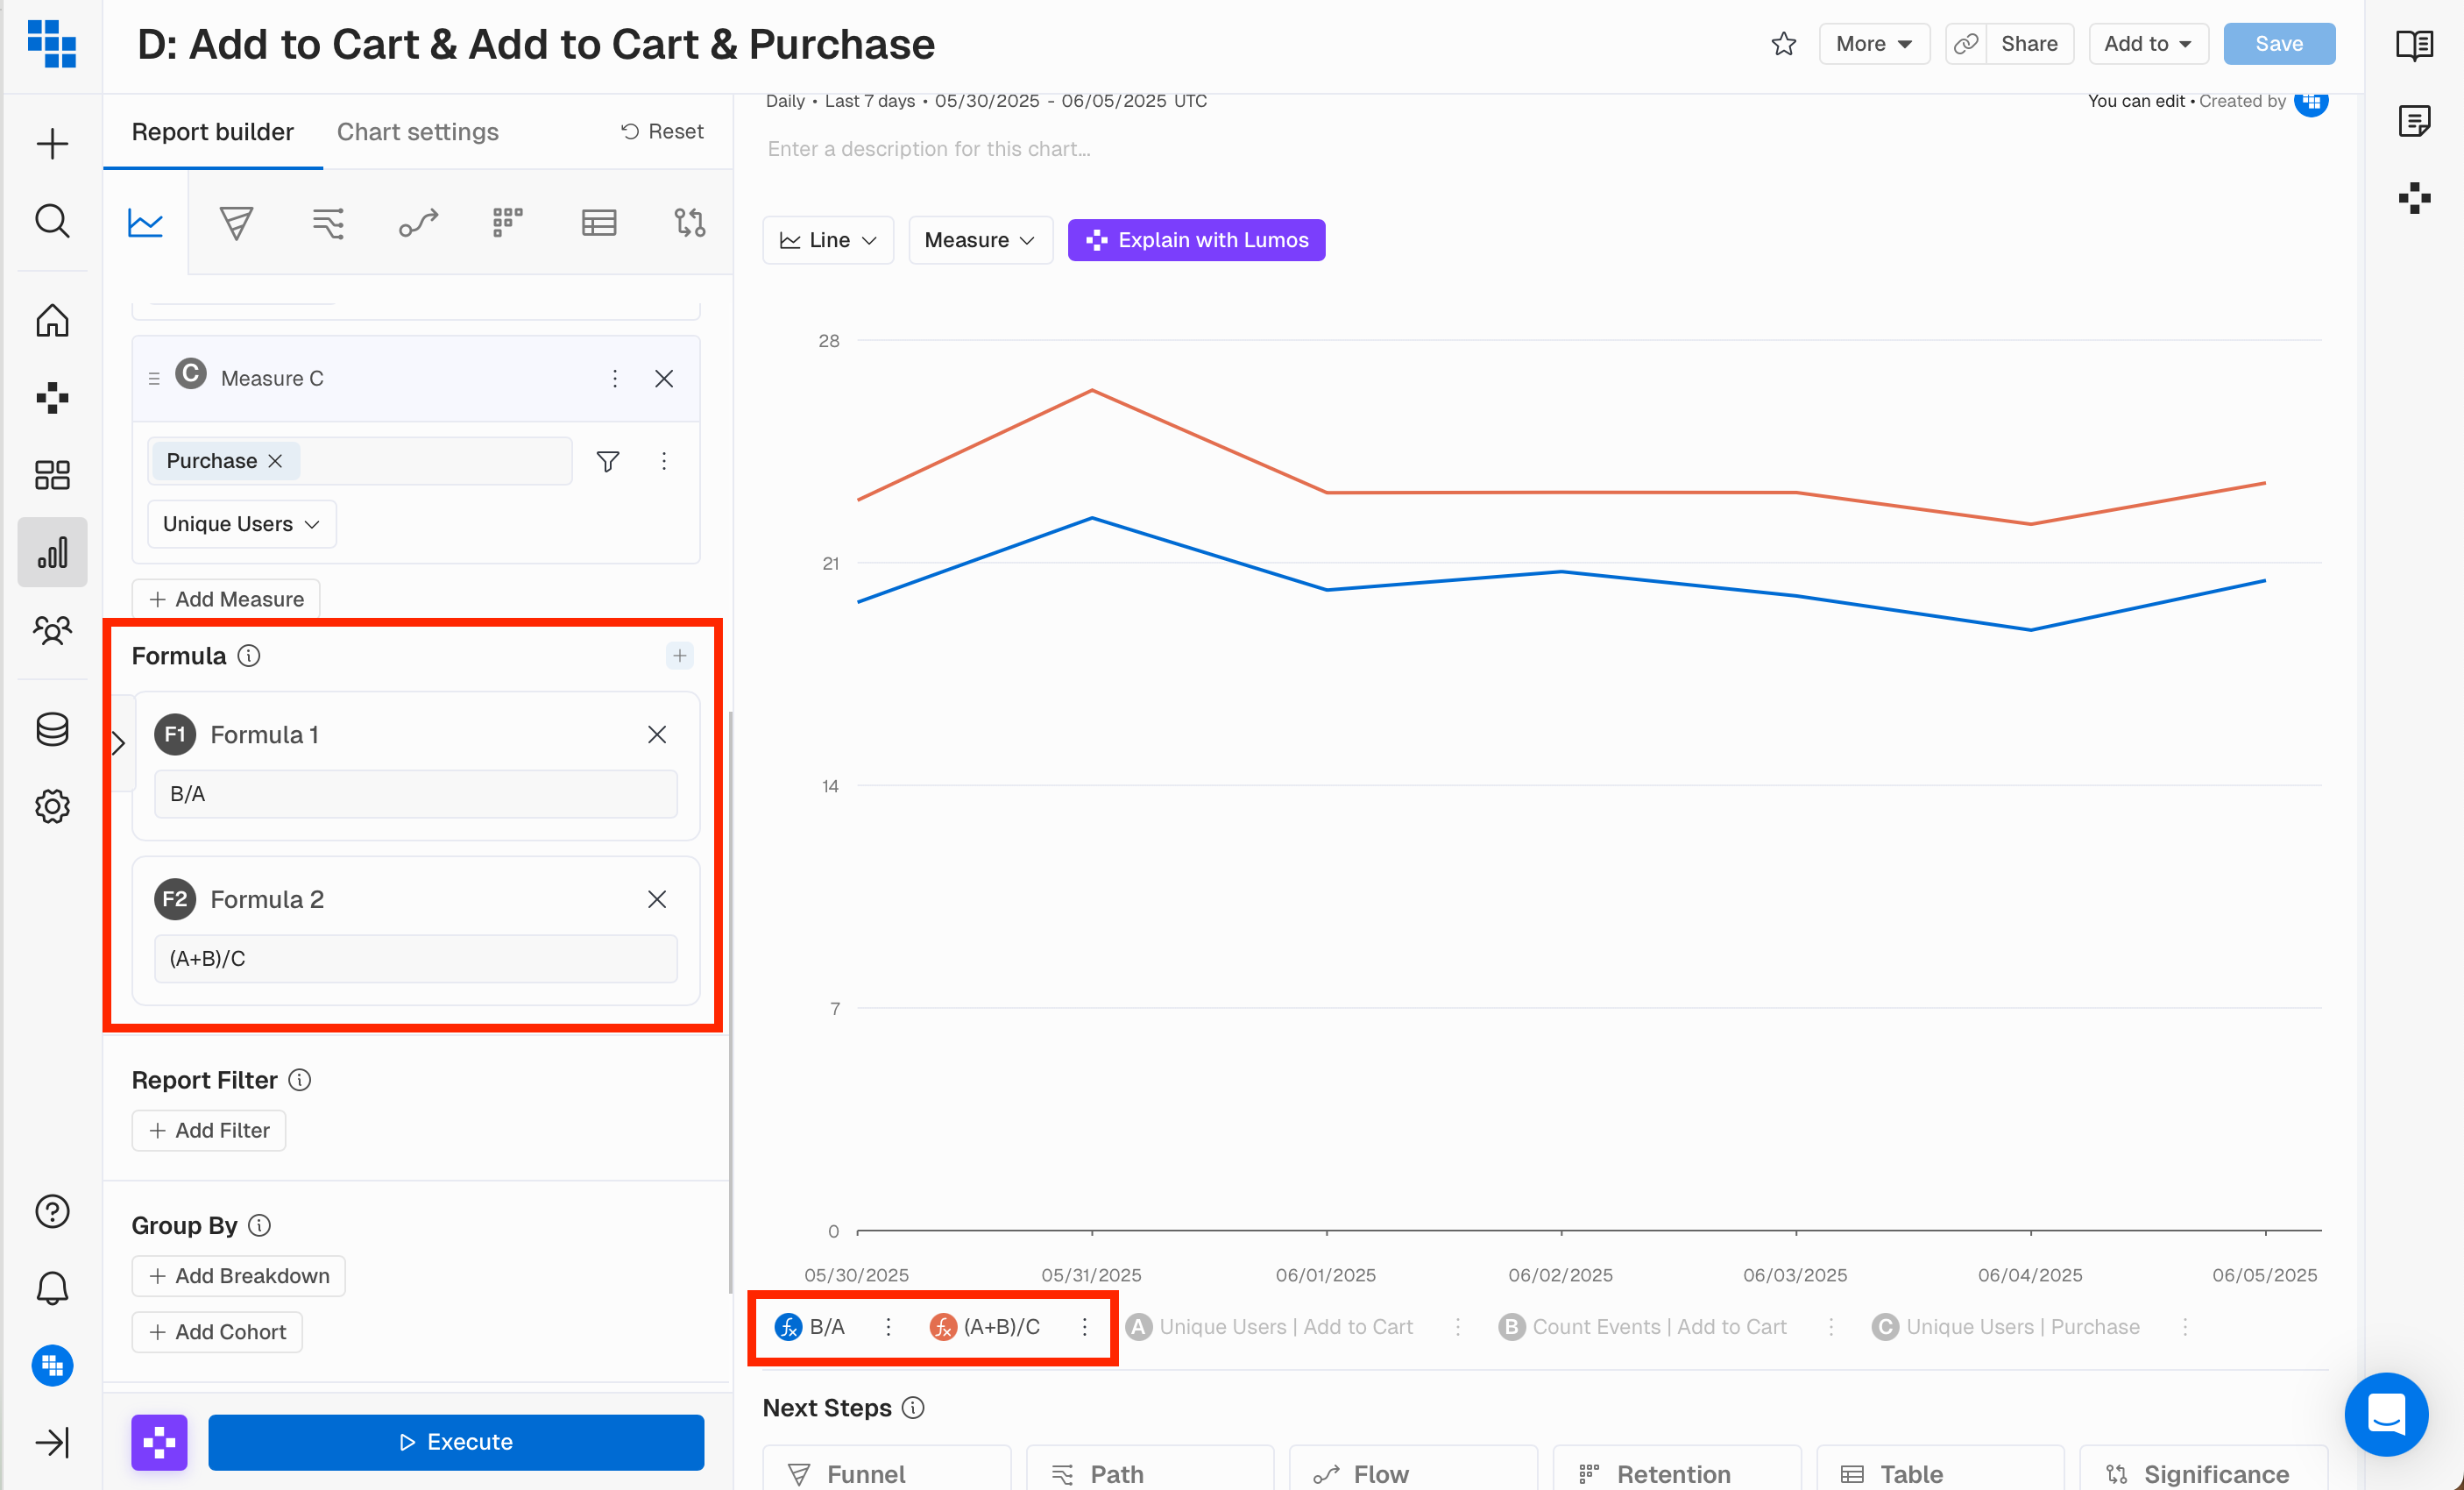
What You'll Love
No more creating separate reports just to get the calculations you need, configure up to 3 Formulas in your Report and they will be displayed as regular Measures on the Chart.
Why This Matters
Complex business metrics rarely fit into a single Formula. Now you can build multiple calculated Measures in one report, keeping your analysis clean and your workflow efficient. Your Formulas can finally match the complexity of your questions.
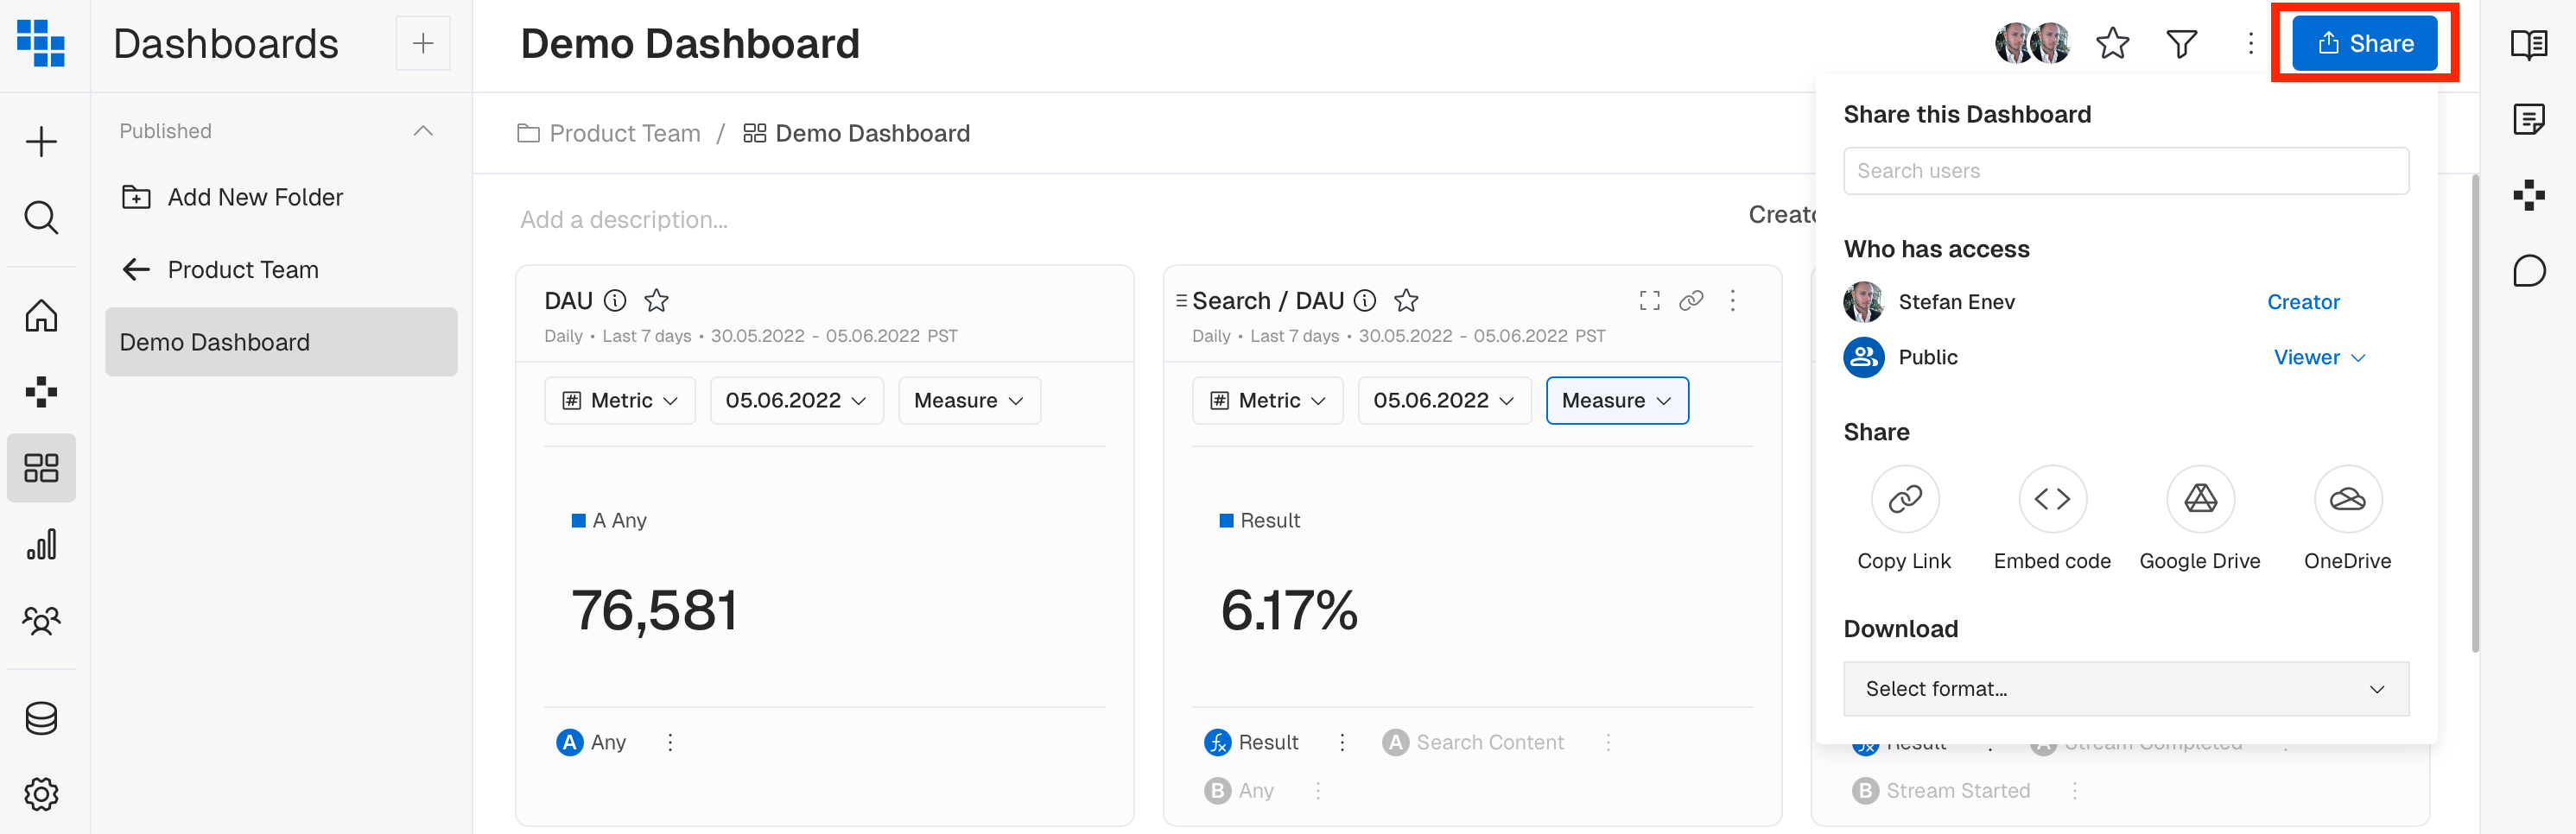
✨ Refreshed Dashboard Sharing
The share widget for dashboards has been redesigned for clarity and consistency.
Find recipients faster, understand permissions at a glance, and collaborate with confidence. A cleaner interface that matches our modern design system - all sharing actions are now available through a single Share button.
🔔 AI Detection Reset
Before: Anomaly alerts were based on older detection logic, leading to inconsistent sensitivity and false positives from outdated historical patterns.
Now: We've wiped all currently displayed anomalies and started fresh. Our latest detection includes historical data limits by granularity (90 days for daily, 26 weeks for weekly, 24 months for monthly), dynamic alert thresholds based on data stability, and automatic handling of highly variable metrics.
The result: Cleaner, more accurate alerts from day one. Every anomaly you see reflects our most intelligent detection capabilities.
R438 — 2026-01-15
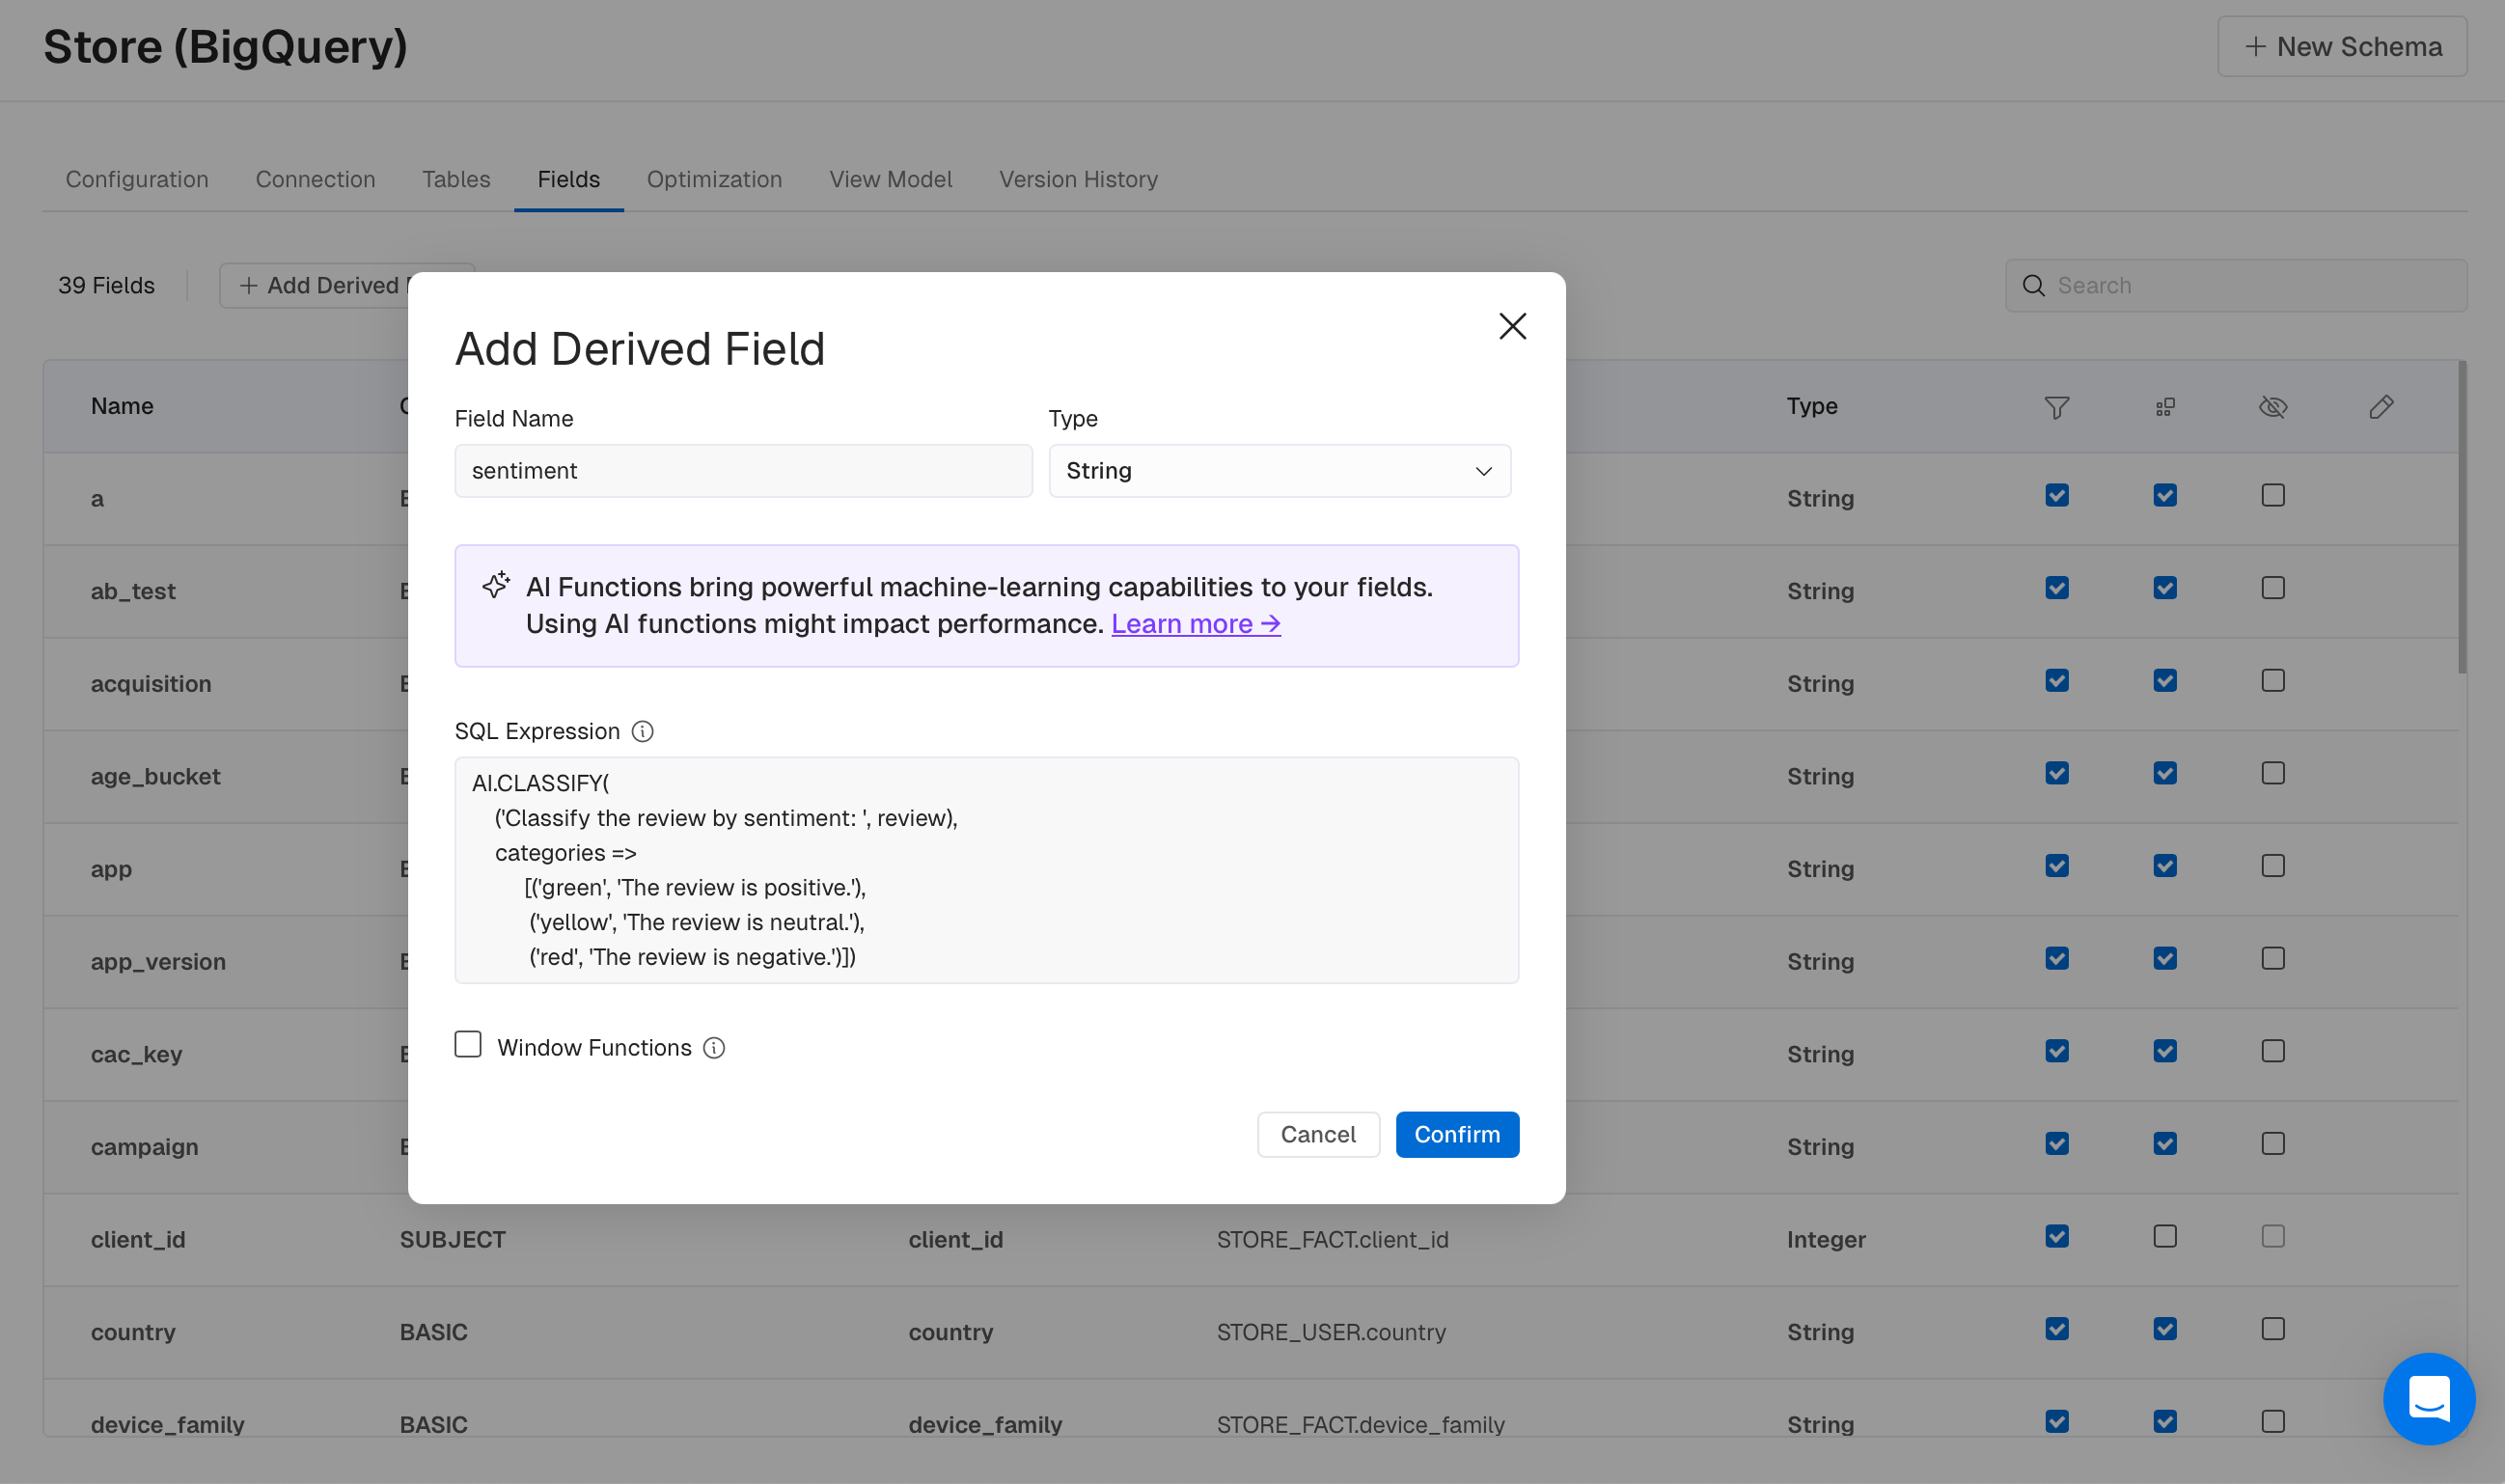
🤖 AI-Powered Derived Fields
You can now leverage your data warehouse's native AI functions (Snowflake Cortex, Databricks AI, BigQuery ML) directly in Kubit. Apply sentiment analysis, text classification, and intelligent filtering to transform unstructured text into actionable insights - no data engineering required.
🤖 Smarter Anomaly Detection
AI Detect just got significantly more intelligent. New statistical methods automatically adjust alert sensitivity based on data stability are dramatically reducing false positives while still catching real anomalies. Plus, in order to ensure statistical significance, historical data windows are capped both on the low and the high end based on the Time Unit as follows:
- Daily: 30-90 days
- Weekly: 12-26 weeks
- Monthly: 12-24 months
- 4-Weekly: 13-26 periods
- Quarterly: 8-12 quarters
- Yearly: 5-10 years
- All Time: 30-90 refresh executions
📊 Instant Results with Smart Caching
Previously run queries now load instantly. Kubit automatically detects when you're running a Report which is identical to a previously run one and serves cached results with a clear freshness indicator. Need fresh data? Click Refresh to force re-execution of the Report.
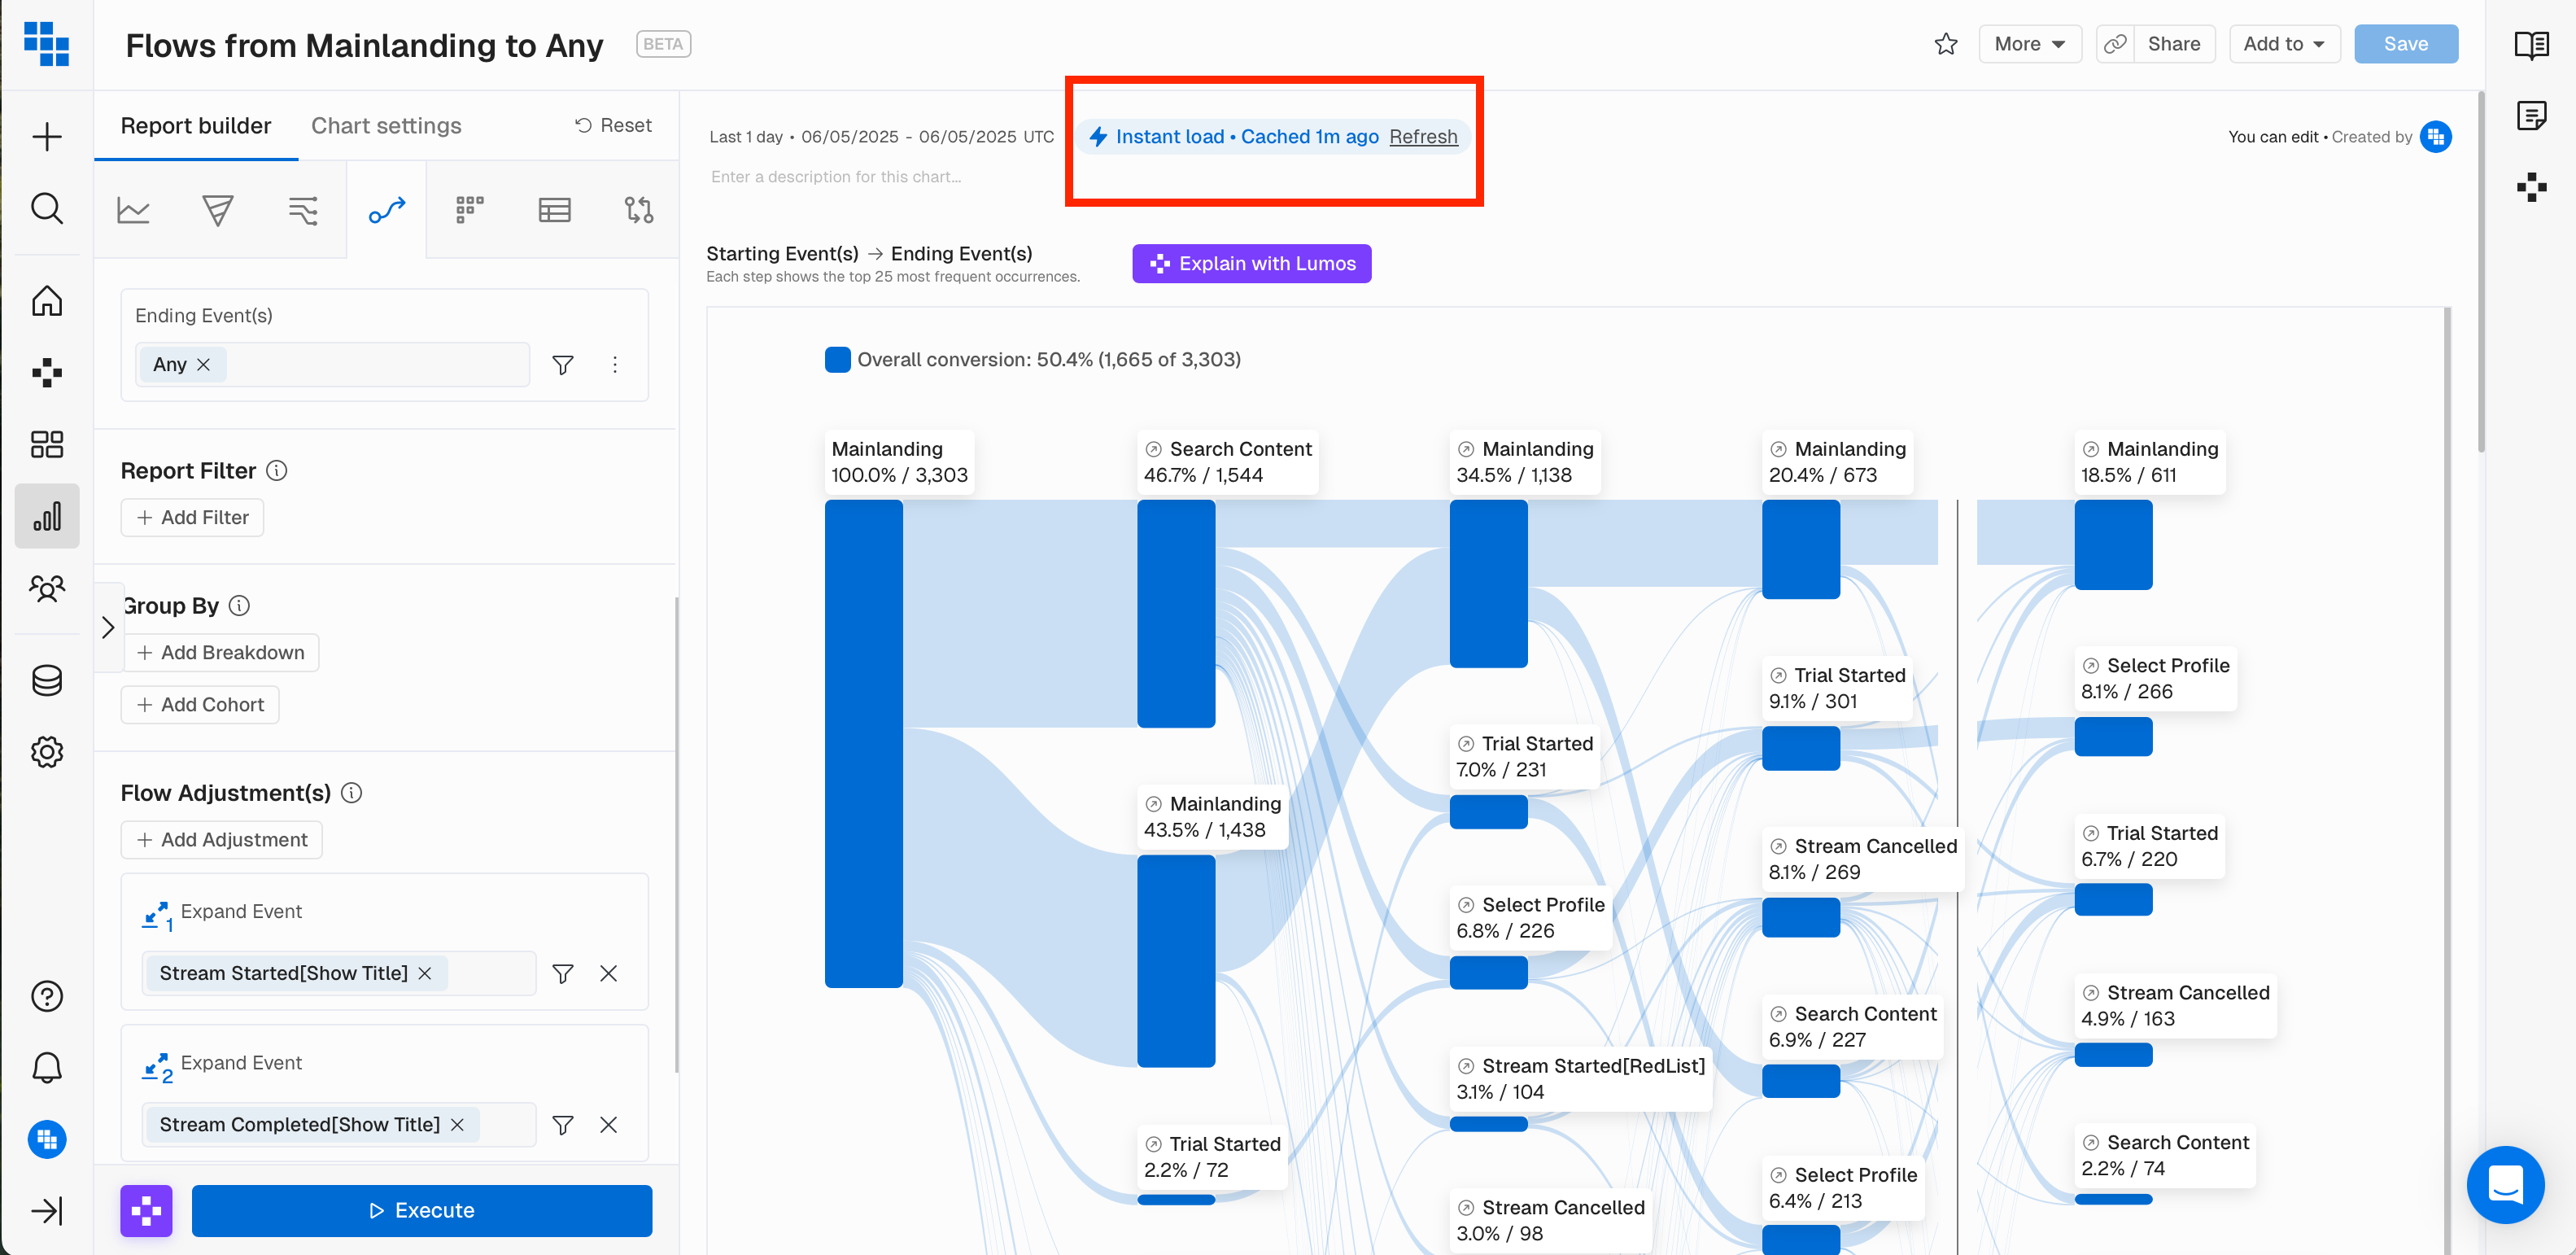
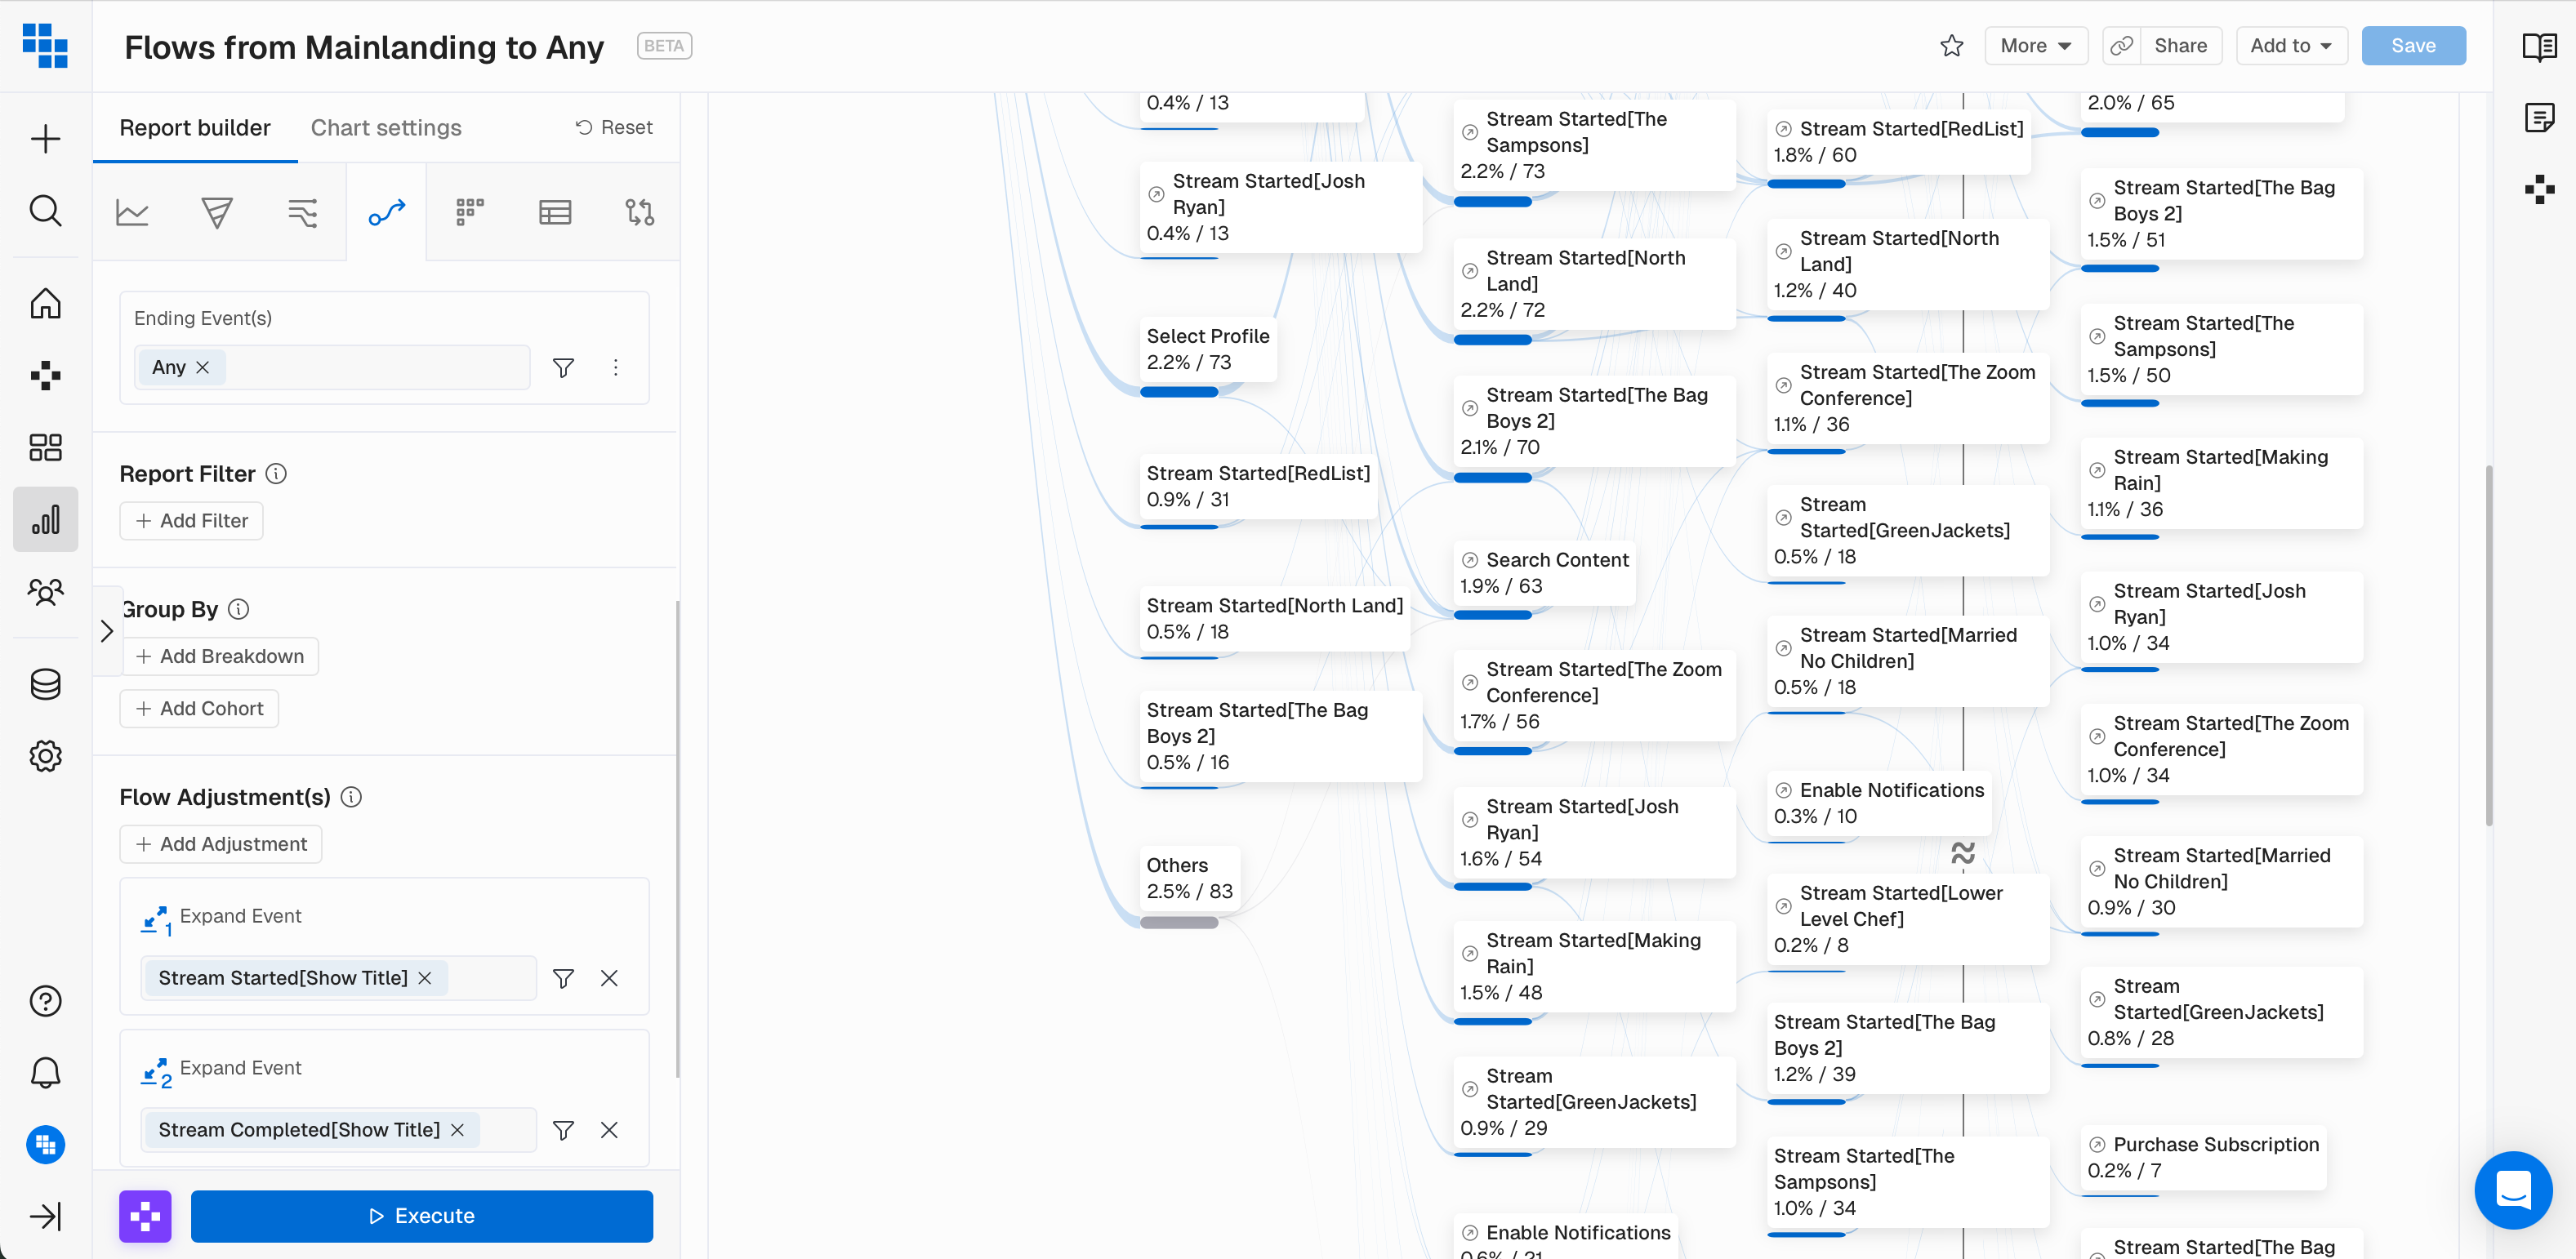
🎨 Better Flow Visualizations
Event names in Flow charts are now displayed with two-line support and hover tooltips. It also applies for expanded events:
R437 — 2026-01-08
⚙️ Smarter Analytics
-
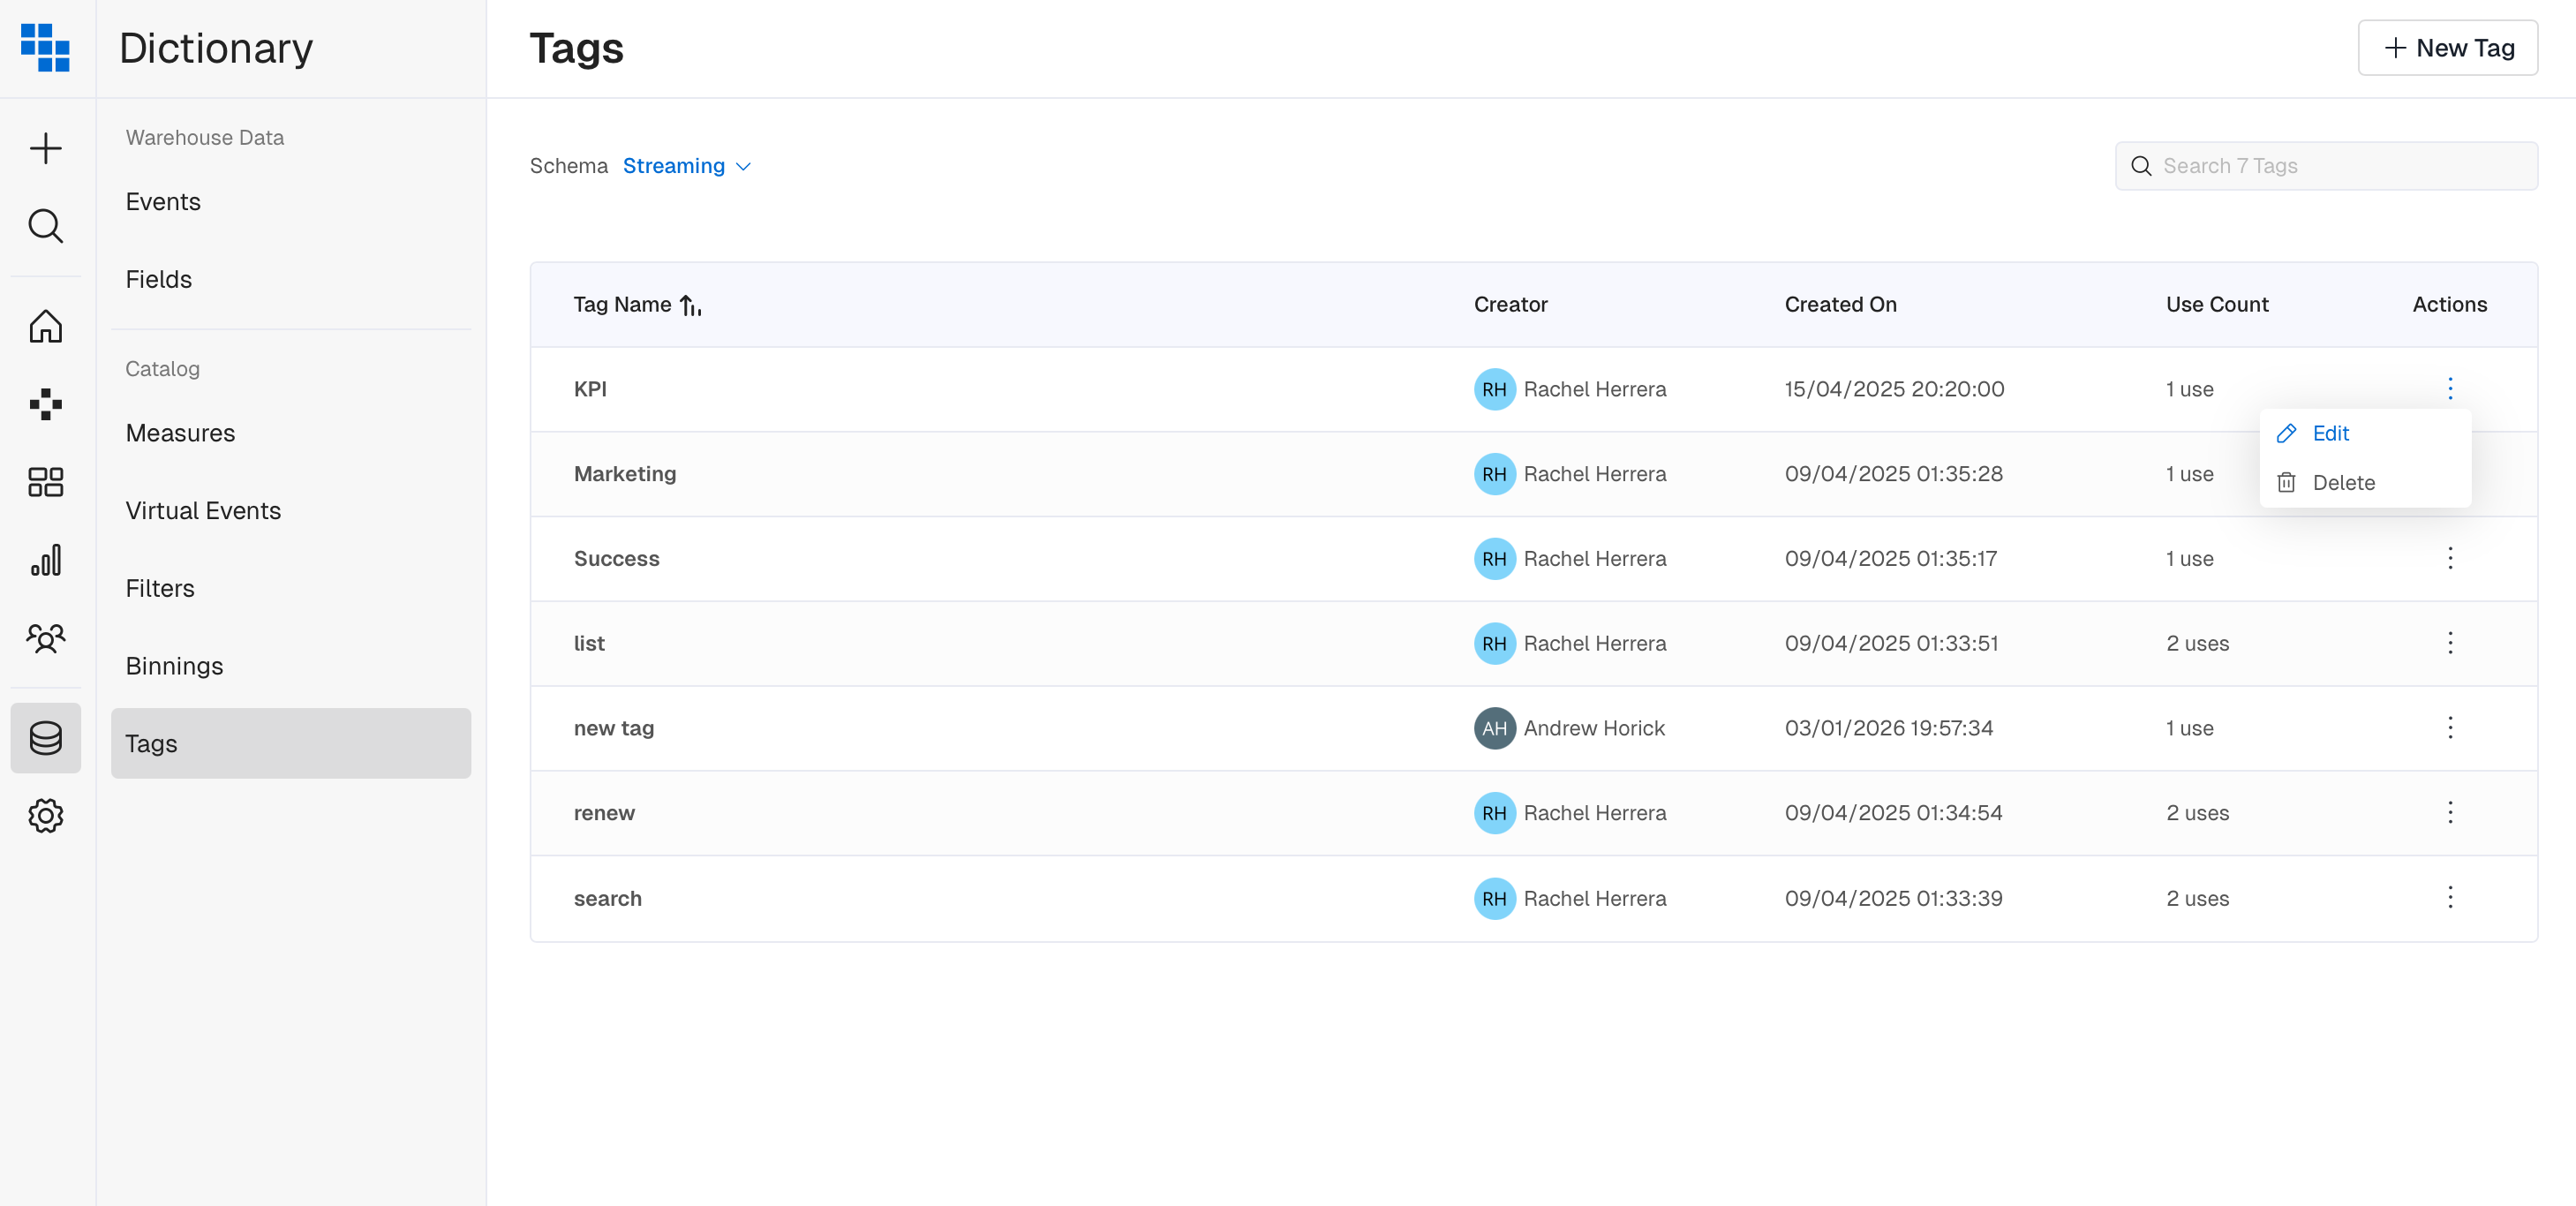
Complete Tag Management — You can now create, rename, and organize tags directly from the Dictionary Tags view.
-
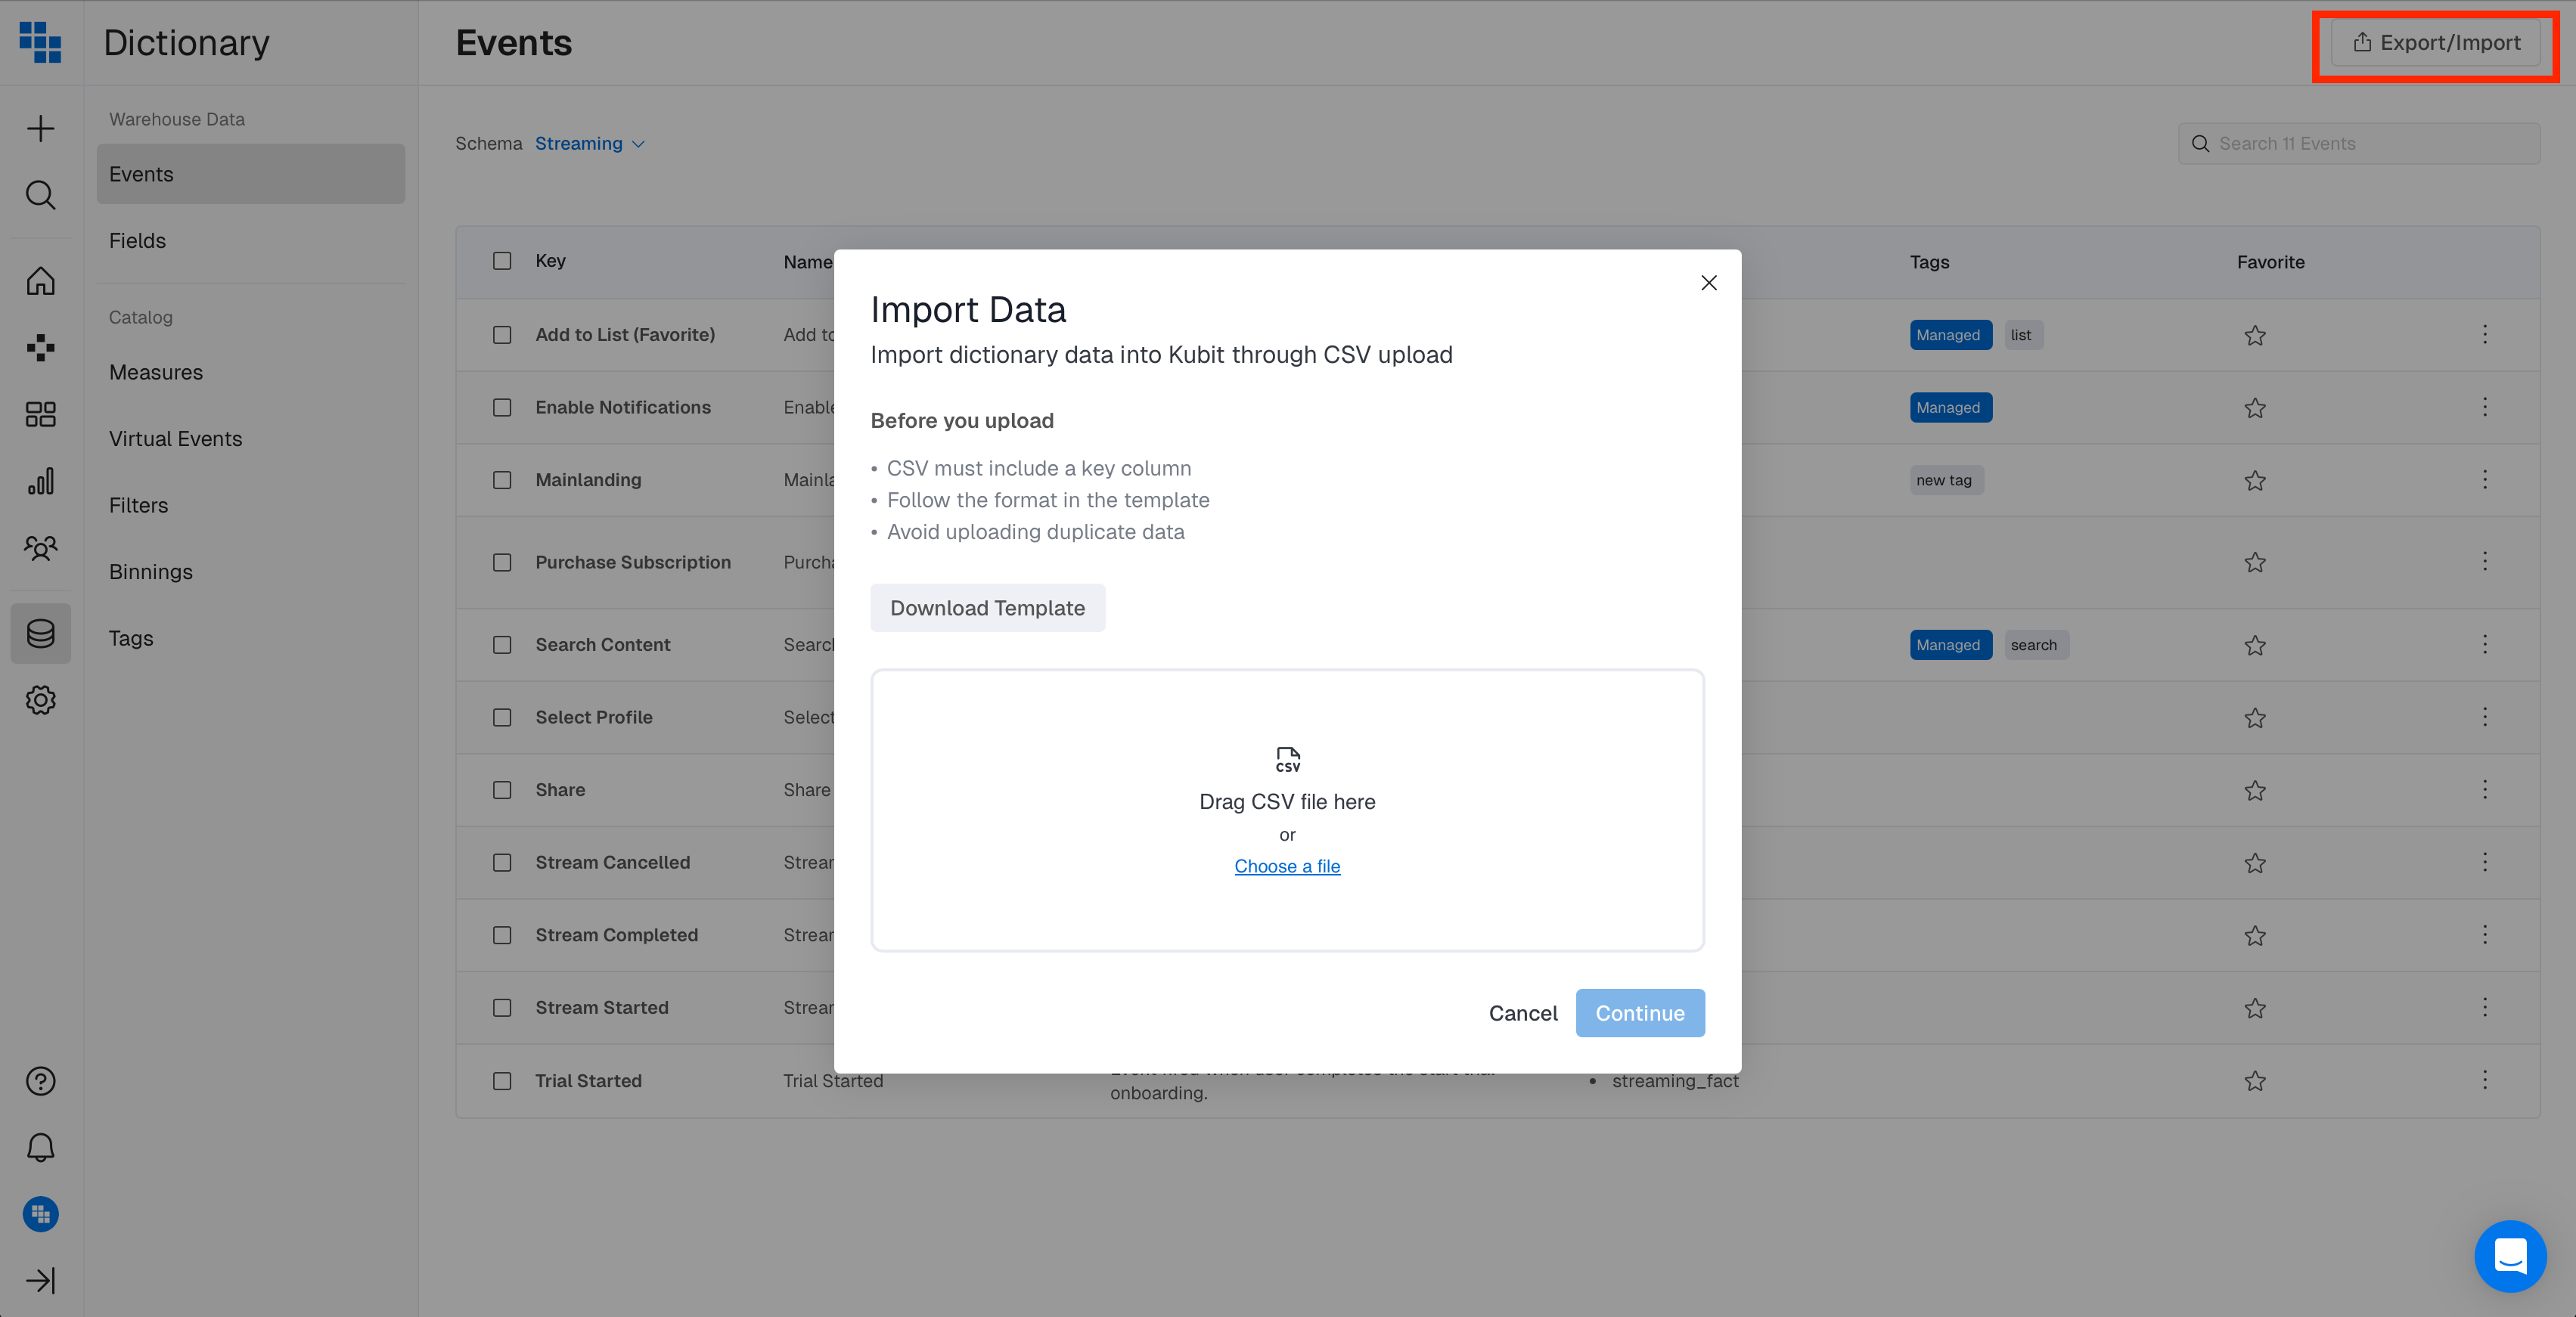
Bulk Metadata Import/Export — Upload CSV files to quickly add descriptions, tags, and metadata to events and fields. Perfect for accelerating your AI Readiness preparation.
-
Enhanced Chart Visualization — Enjoy a larger chart panel for analyzing complex visualizations during deep dives and customer reviews.
🔍 Improved AI Detection
- Smarter Anomaly Detection — We've refined our AI Detect algorithms to better handle warm-up periods, giving you cleaner alerts with fewer false positives.
🎁 Experience Improvements
-
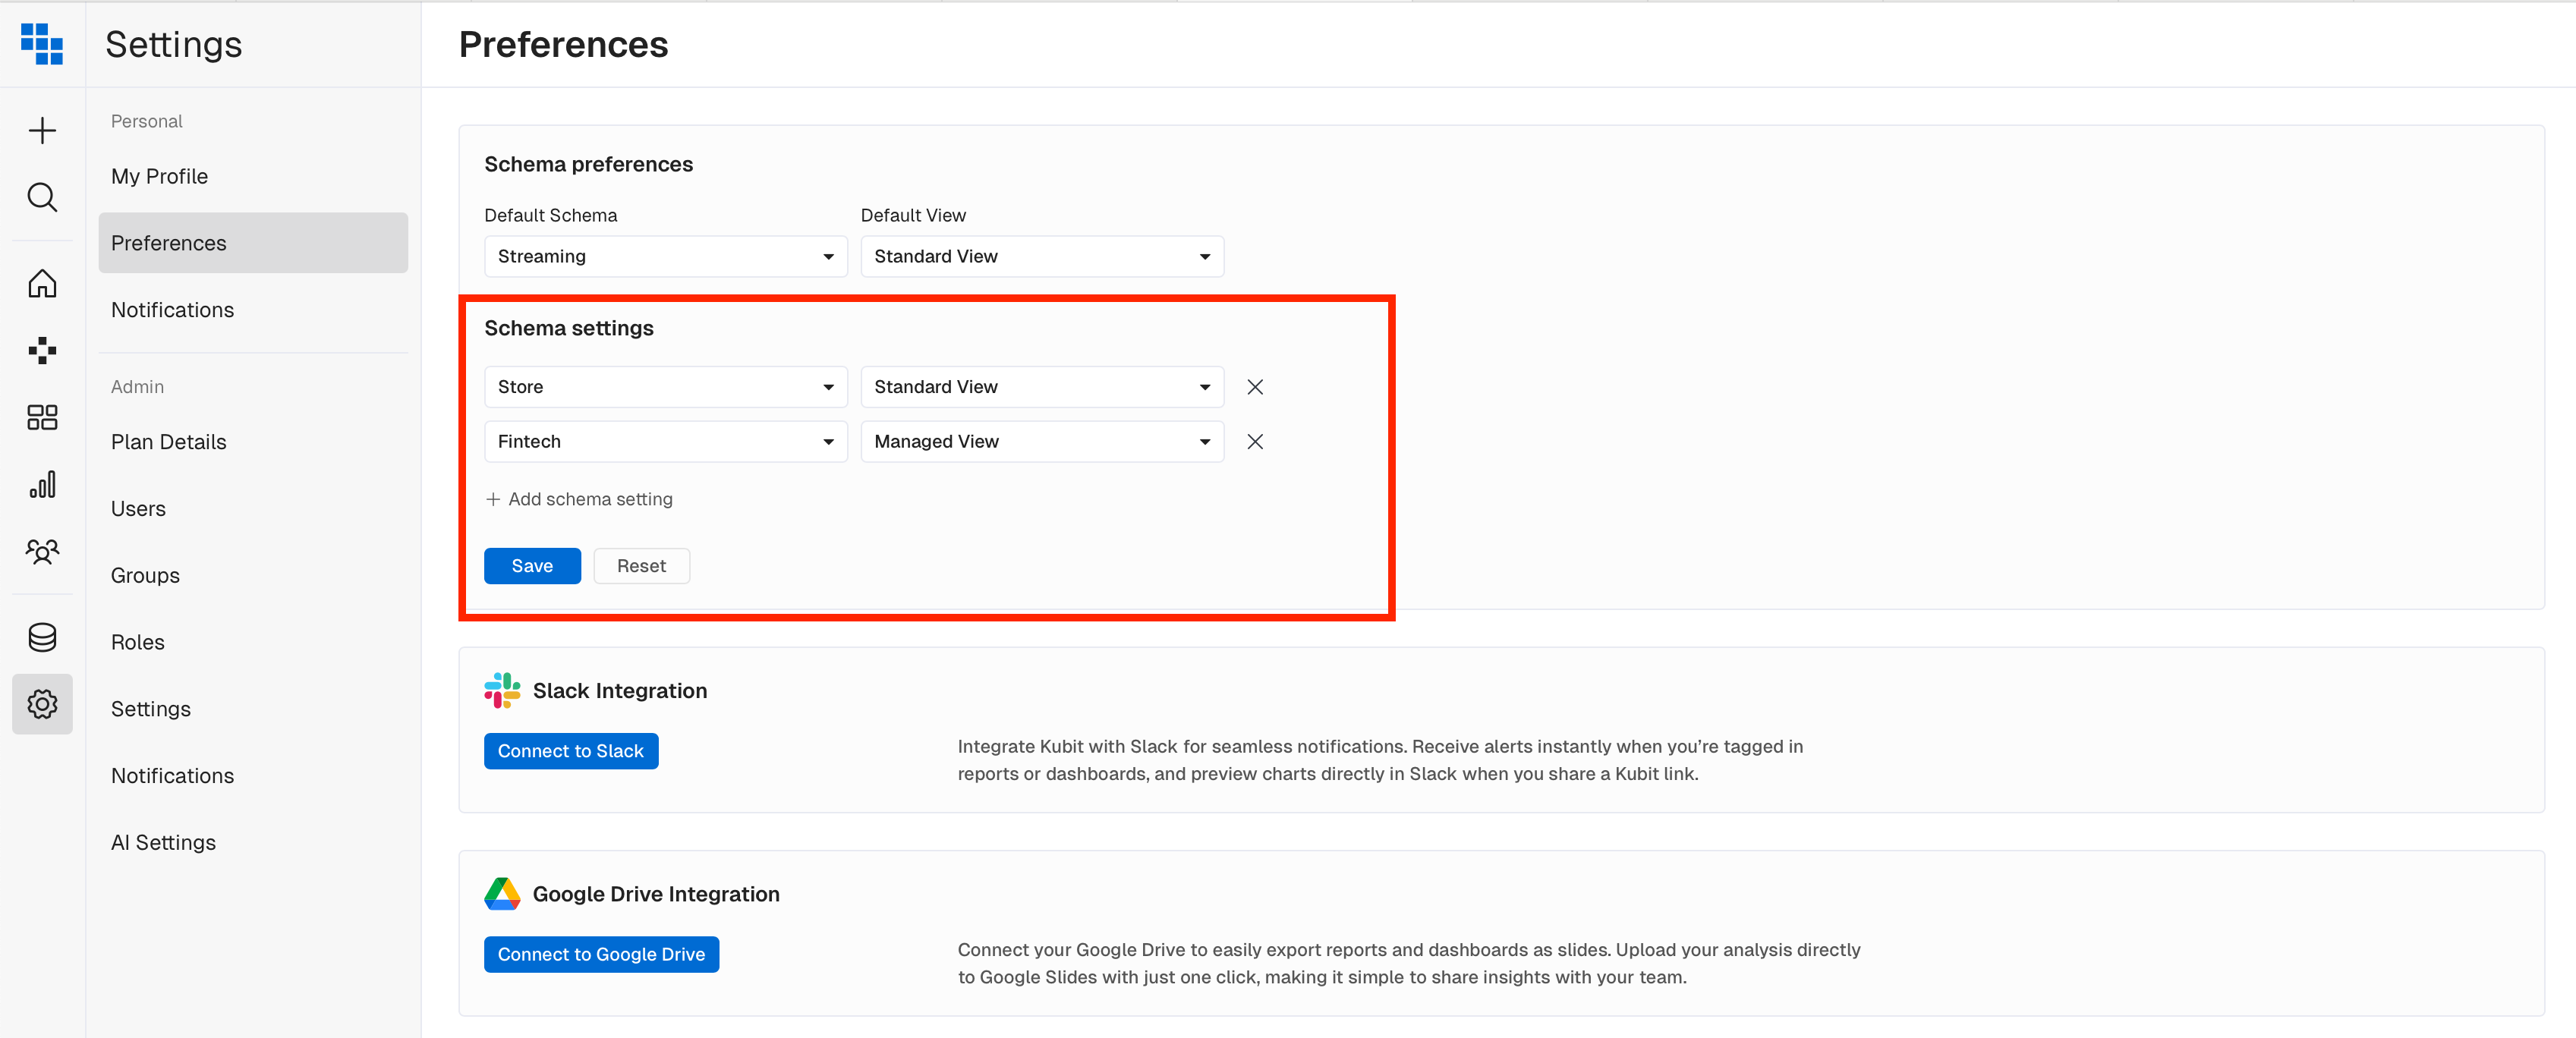
Schema-Specific Managed Views — Configure managed view settings independently for each schema with the ability to set defaults.
-
Unified "Cohort" Terminology — We've updated "Segment" to "Cohort" throughout the product for clearer, industry-standard language.
Updated 20 days ago