Schedule Report and Dashboard Refresh
Keep your Dashboards and Reports up-to-date with automated scheduling and anomaly detection.
What is a Schedule in Kubit?
Once you've created a Report or Dashboard you may want to monitor the metrics displayed regularly. Rather than manually refresh the report or Dashboard you can create a Schedule to refresh them.
When a Schedule executes all data on the Report or Dashboard will be updated to the most recent data.
How to Create a Schedule
Schedules can be created on the object you want to refresh via the vertical More menu in the upper right-hand corner.
Who can create a scheduleCurrently, only Admin, Governor, and Creator Roles can create a Schedule. Reach out to your Kubit Admin to enable this feature if it's not available to you.
The experience is consistent for Reports or Dashboards.
- Click the More menu in the upper right corner and select Create New Schedule.
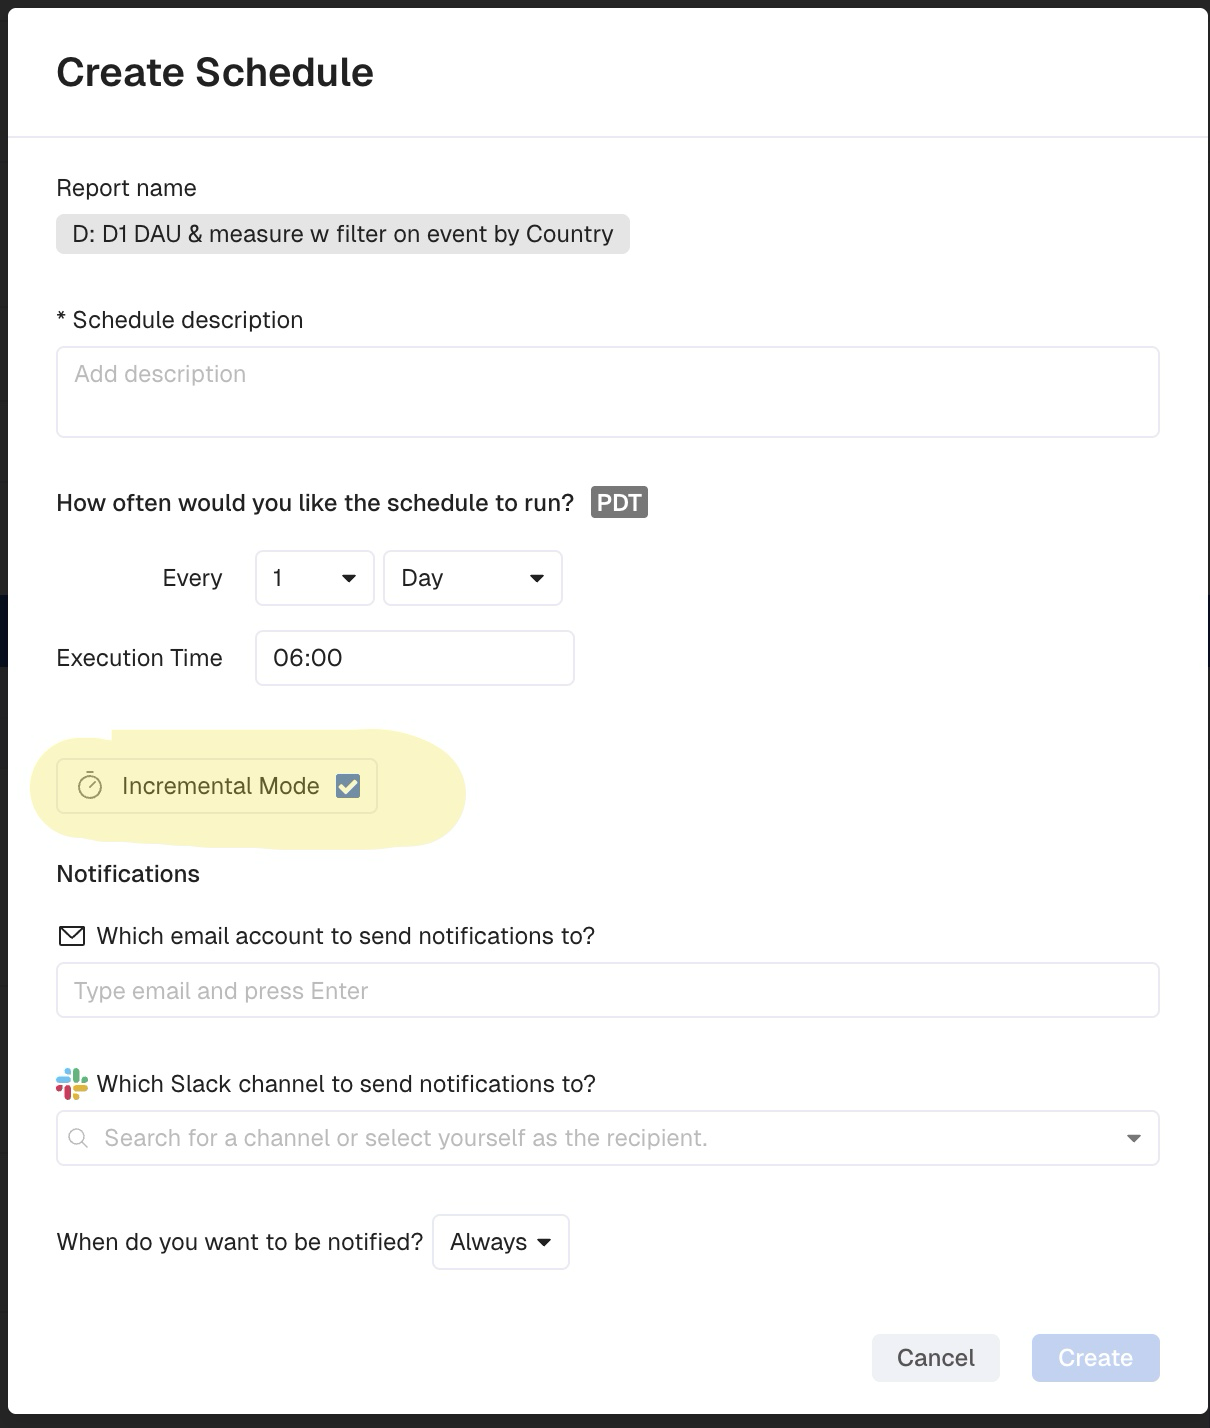
- Once the Schedule modal appears you can configure a Name and Description.
- Set your Schedule refresh frequency for your Report or Dashboard. Every Day, Week, or Month?
- It's important to consider how often the underlying data is refreshed and visualized.
- If data is refreshed or visualized Weekly then select Week as your refresh schedule.
- Select the time of day this Schedule will execute. The Schedule will execute according to your Browser timezone.
- If you are refreshing a large dashboard or several items it's best to schedule the refresh outside of regular working hours. This ensures your queries are performing at the highest level.
- Determine if you'd like the report Refreshed Incrementally, this means only new dates will be retrieved and will save on execution time and compute.
- (Optional) Select Recipients is not required unless you have set to receive Alerts Only.
- You can send notifications via email and/or connect to Slack and share with a Channel.
- Learn more about how to enable the Slack integration .
- You can send notifications via email and/or connect to Slack and share with a Channel.
- Determine if you always want to be notified or only when an Anomaly is detected on your report or Dashboard.
- Don't worry, both options will refresh your data no matter what.
- If you select Alert Only you must select an Email and/or Slack recipient before you can create the schedule.
- When you select Alert Only you'll also have the ability to select which reports you want to set alerts for. This ensures that only the critical metrics will trigger an email or Slack notification.
- Hit Create and you're set!
Alert Only toggleWhen Alert Only is toggled on, the Dashboard will be refreshed as configured but an email or Slack notification will be sent only when at least one chart on the Dashboard contains an anomaly .
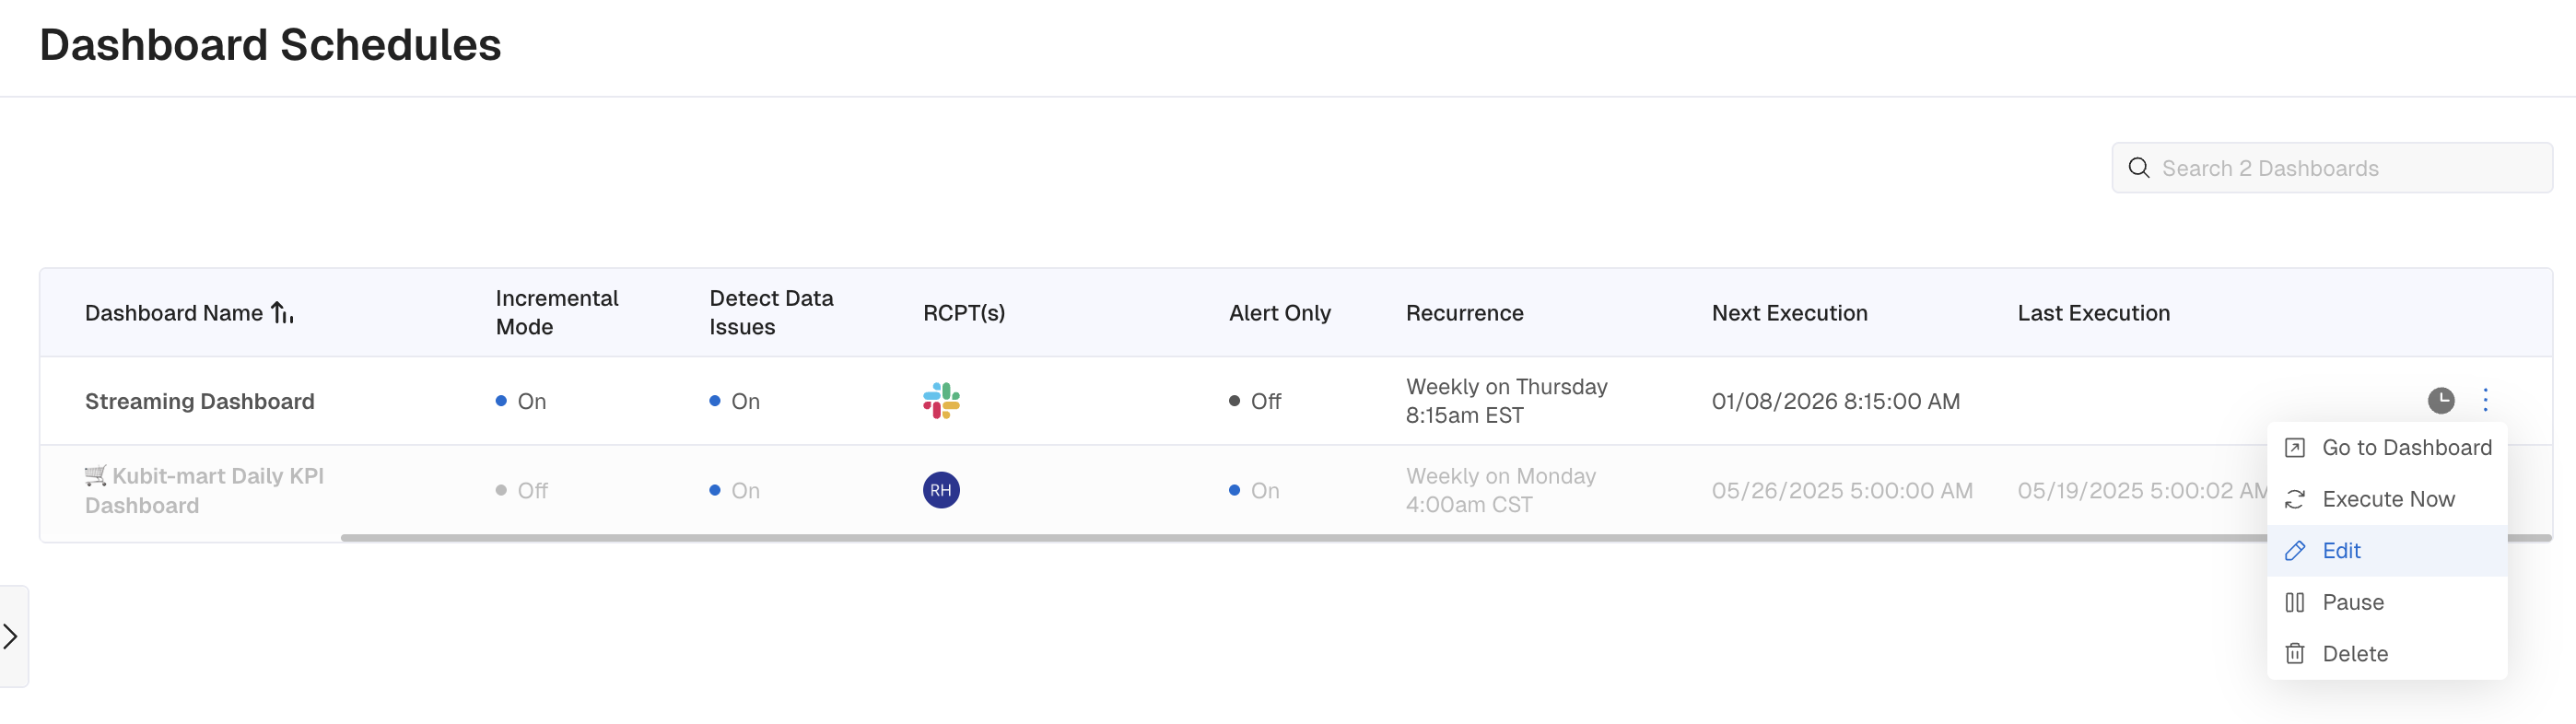
Modify a Schedule
You can navigate to the schedules in the Data Management section. Once you see the list of all schedules you can click on the three-dot menu and:
- Go to Dashboard or Analysis to find the relevant schedule.
- Execute Now to immediately refresh the item and send it to the recipients (if Alert Only conditions are met).
- Edit the Schedule and change the name, description, recipients, recurrence and alert-only flag
- Pause to stop the schedule from executing without deleting it.
- This is most useful when data issues are being fixed and until it is resolved it's better to not refresh and alarm other stakeholders.
- Delete will delete the Schedule forever.
Using the Slack Integration
Learn about setting up your Slack integration here.
Things to consider:
- You can send a Schedule to both email recipients and Slack channels.
- You can only add one Slack channel to a schedule.
- If you send the notification to yourself, you'll find the notification in the Apps section in Slack.
Anomaly Detection
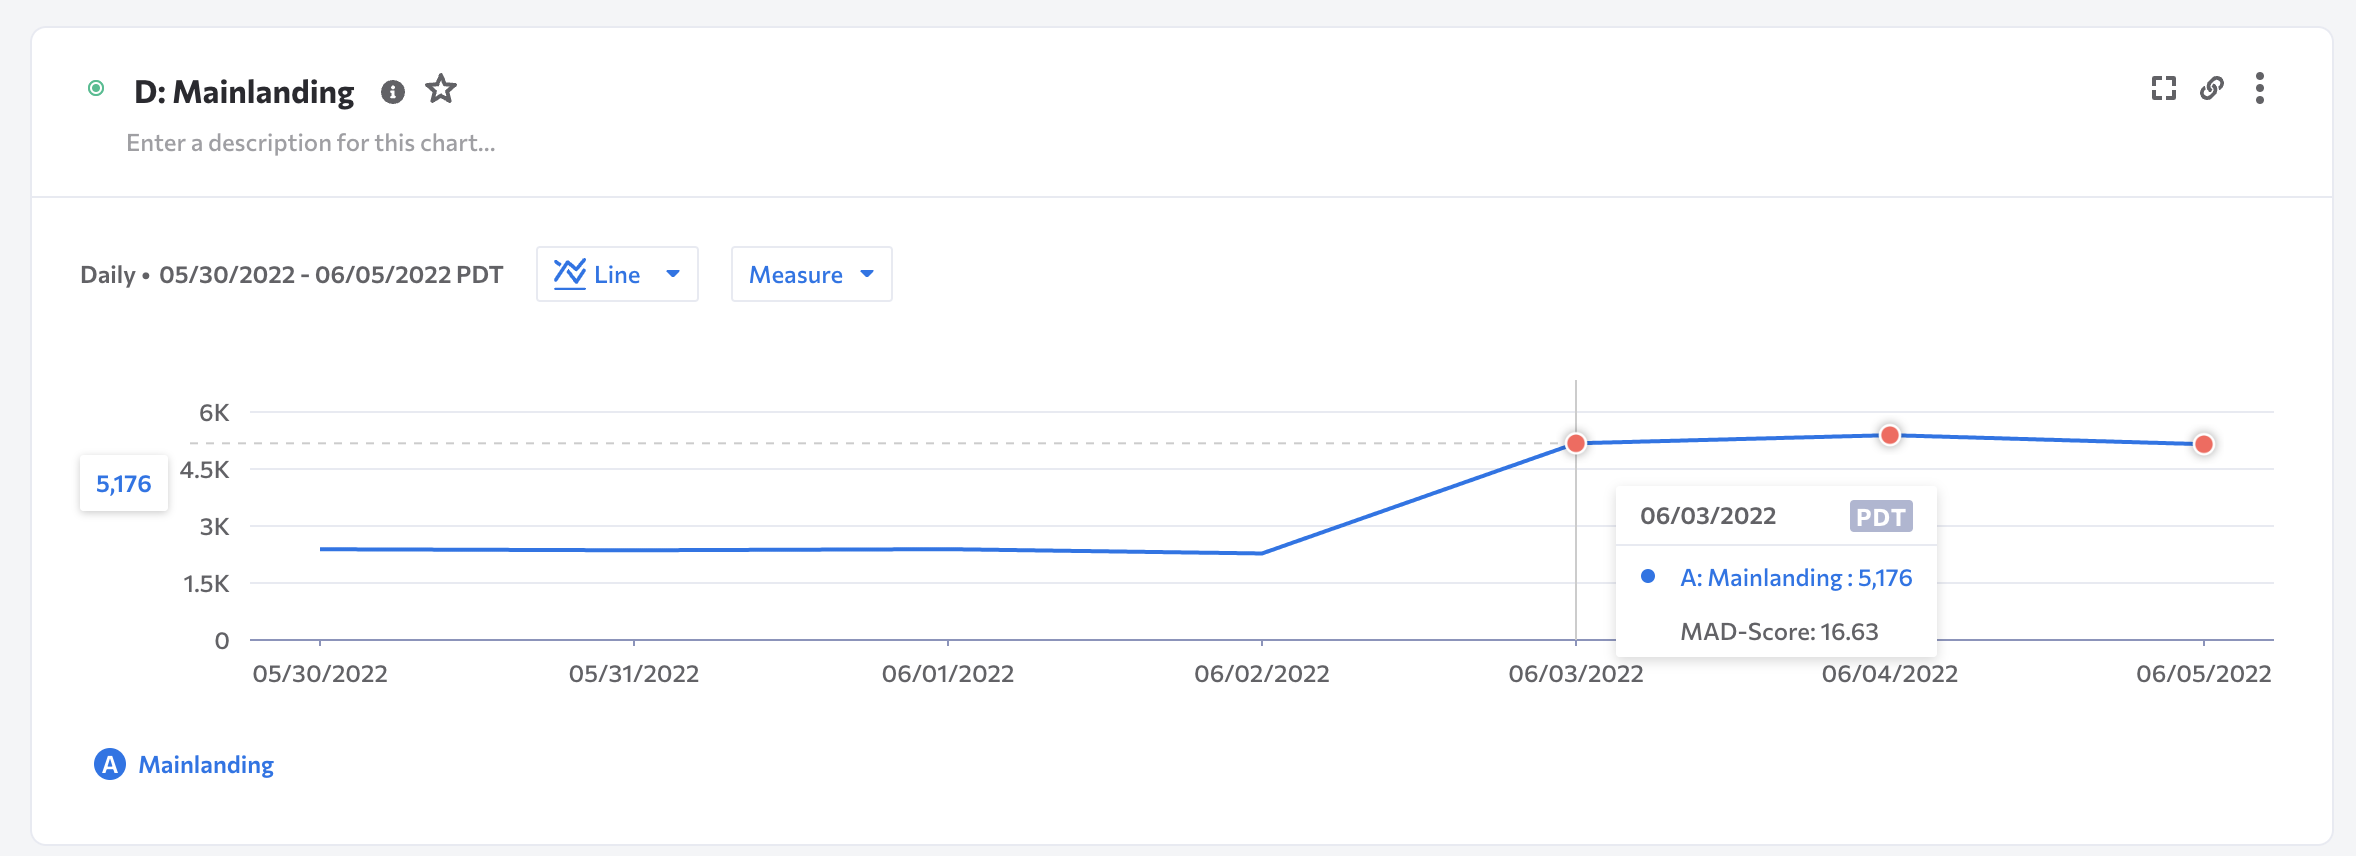
For every time series analysis, Kubit's anomaly detection engine automatically calls out outliers as red dots on the chart.
- Behind the scenes, a machine learning model based on historical data that considers seasonalities, skips known incidents, and reduces false alarms.
- Mouse-over shows the Z-score or MAD score of the incident data points compared to the predicted values.
- Here is a helpful guide on how to interpret the values.
- The Z-score measures how far a point is away from the mean (average); large absolute values of the Z-score suggest an anomaly. So, the further away from
0the more severe the anomaly, both positive and negative. - MAD stands for median absolute deviation from the median. So, in contrast, rather than using the mean, the MAD score uses the median. This helps smooth out the anomalies in the data set that may skew up the mean and result in a less impactful anomaly.
- The Z-score measures how far a point is away from the mean (average); large absolute values of the Z-score suggest an anomaly. So, the further away from
- Here is a helpful guide on how to interpret the values.
- Kubit will display the score that triggered the anomaly so you're sure to know how we came to the finding.
Anomaly detection not applied to all report typesAnomaly Detection is applied only to line charts such as Query or Funnel. One chart can contain multiple anomalies.
Detect Data Issues
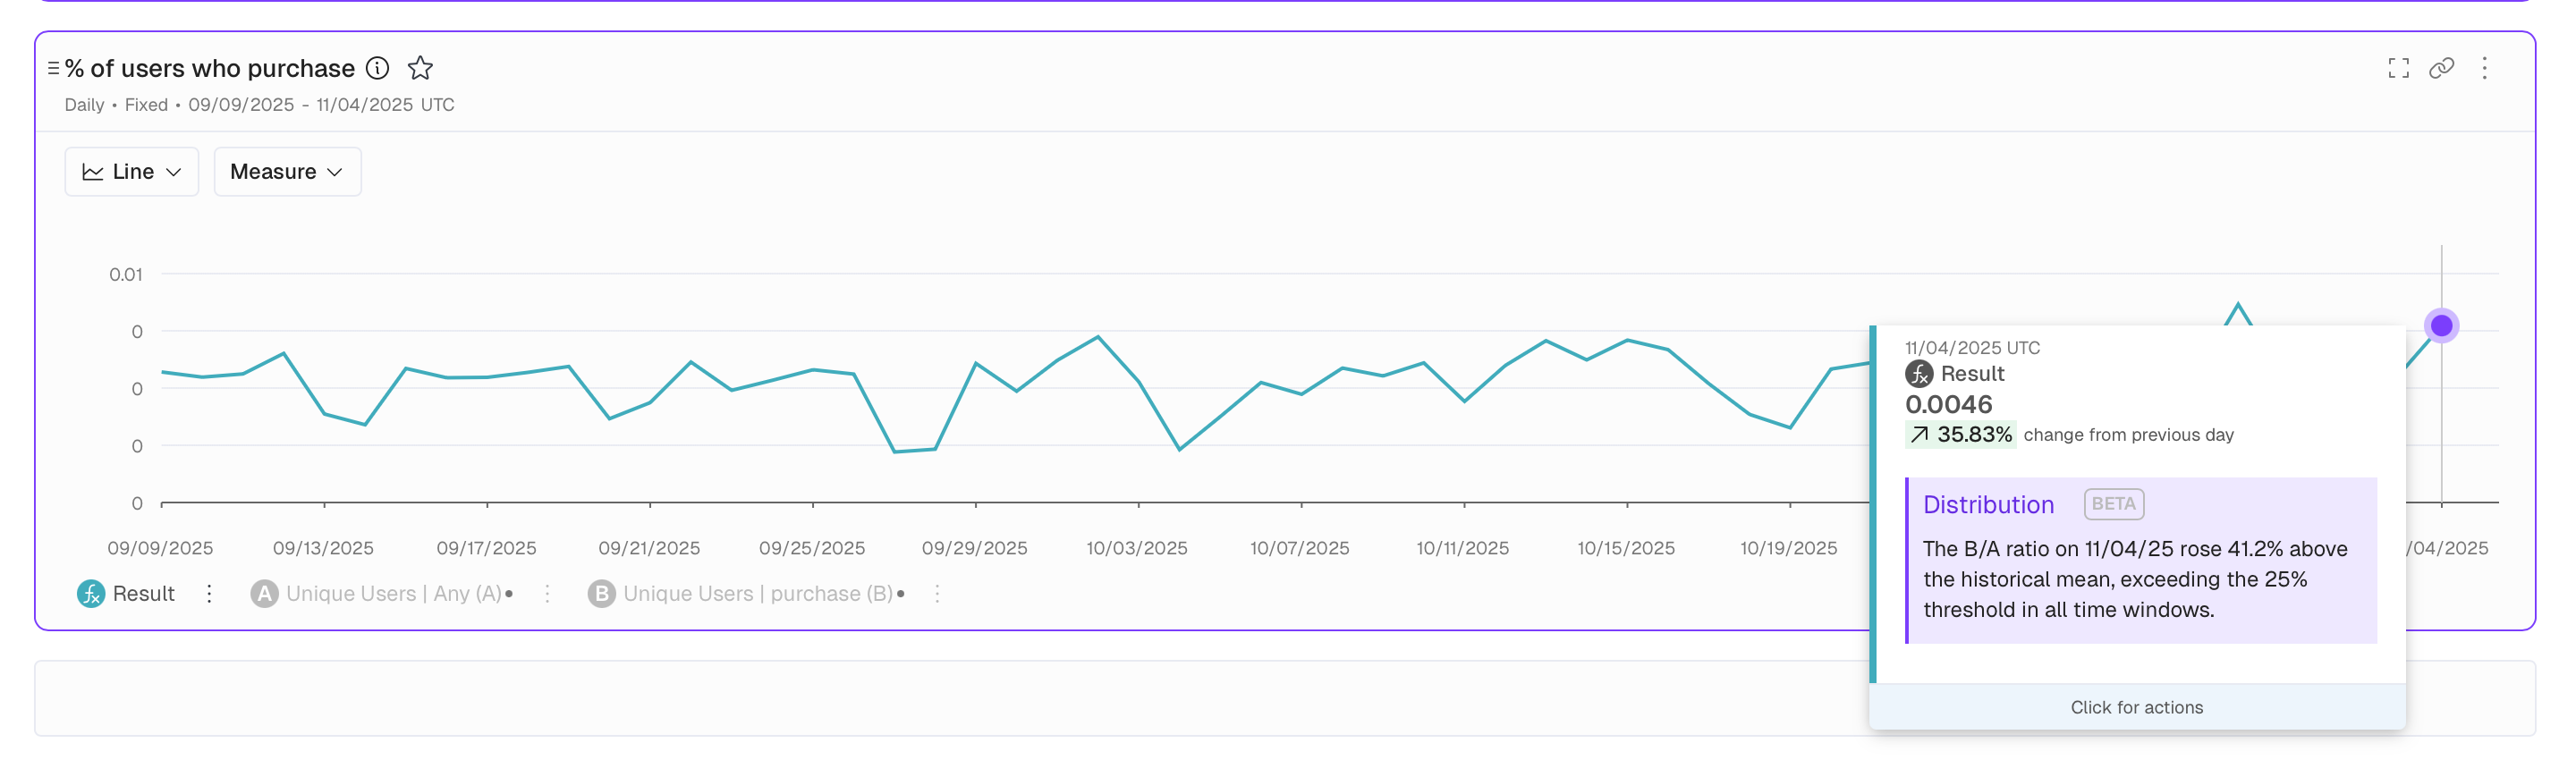
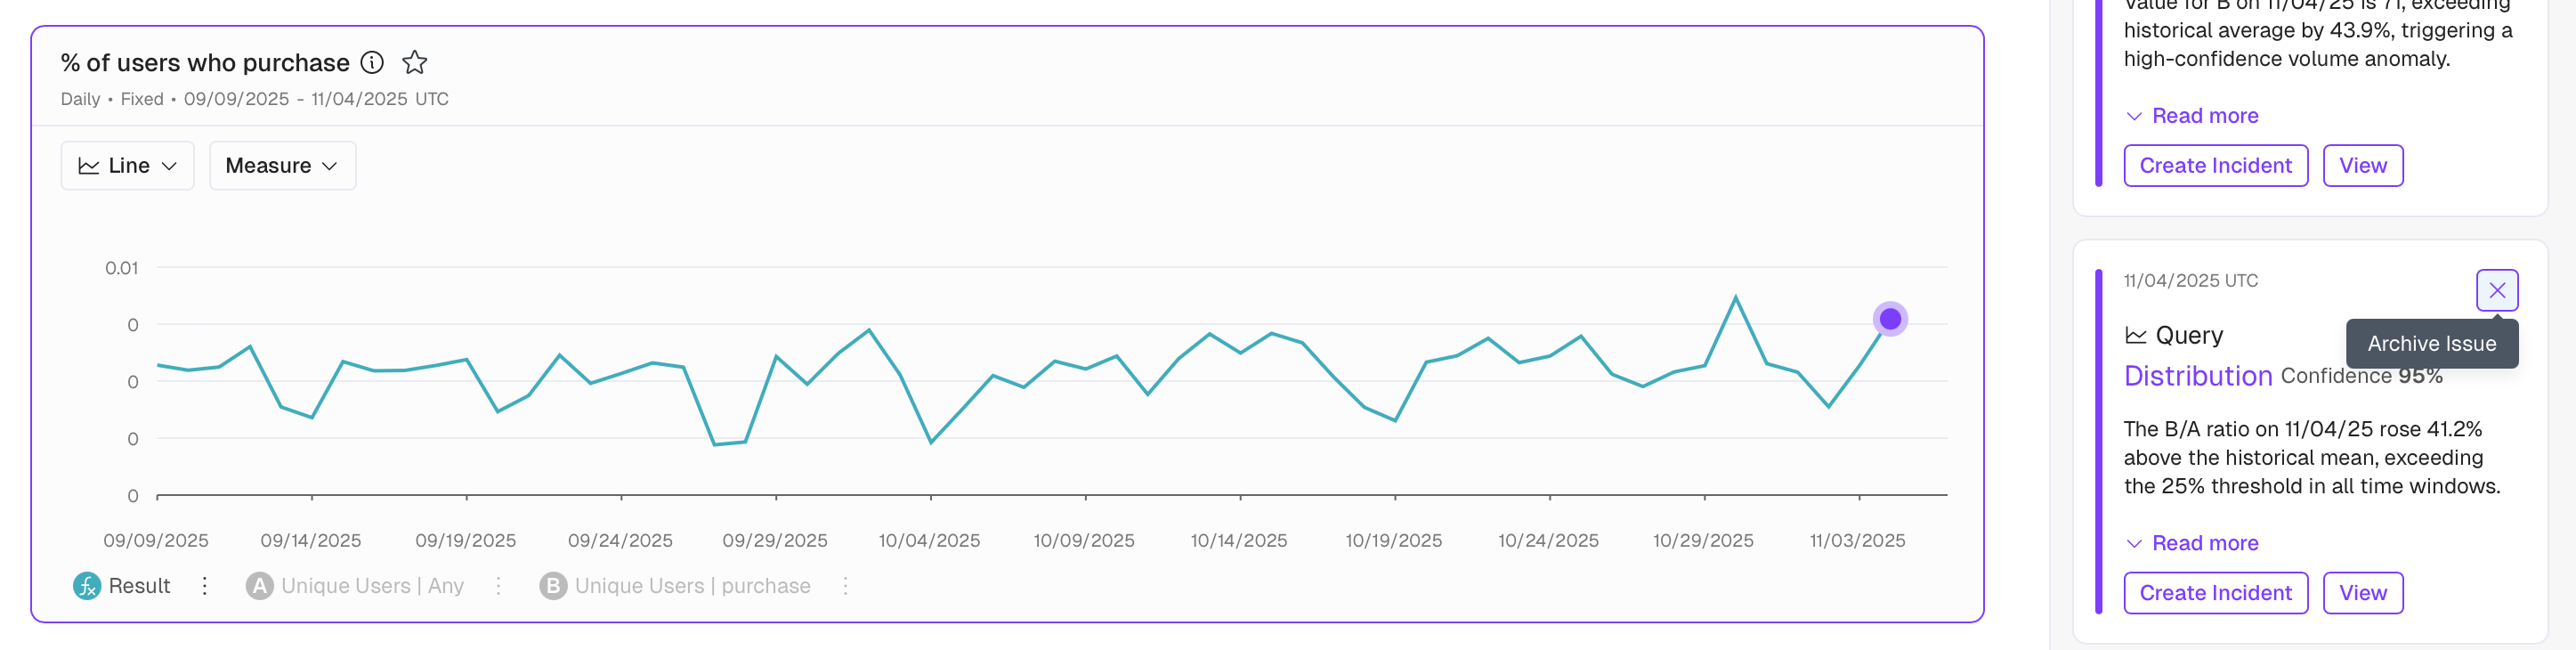
For every time series analysis, Kubit's anomaly detection engine automatically calls out outliers as purple dots on the chart. Behind the scenes, an AI model based on historical data that considers seasonalities, skips known incidents, and reduces false alarms.
There's 3 types, or categories, of anomalies detected by Kubit:
- Volume: Abnormal record counts
- Distribution: Abnormal values in comparison with historical patterns
- Freshness: Missing or delayed data
Anomalies are displayed for the following report types:
- Query
- Funnel (when
Mode: Conversion)
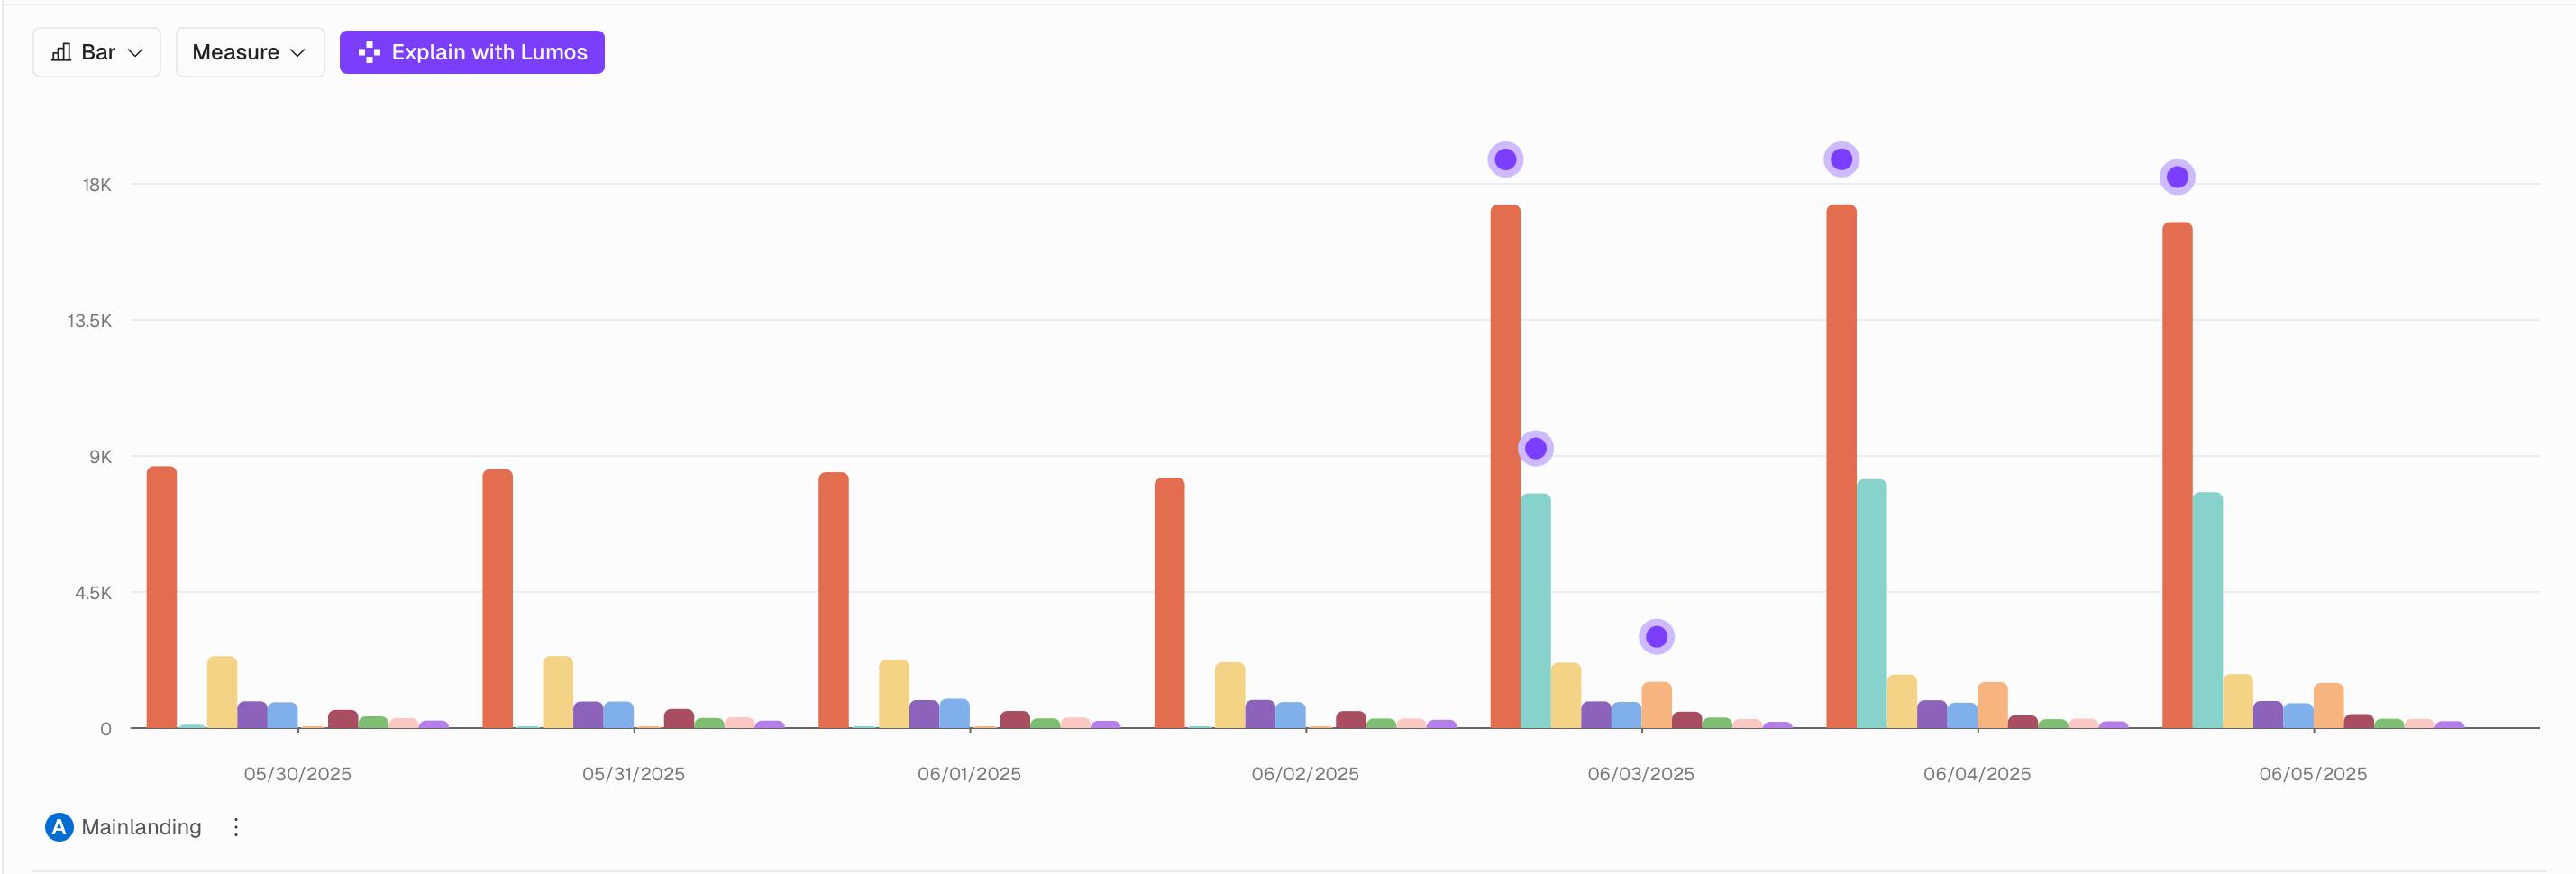
and even when there is a Breakdown applied:
What constitutes an Anomaly?
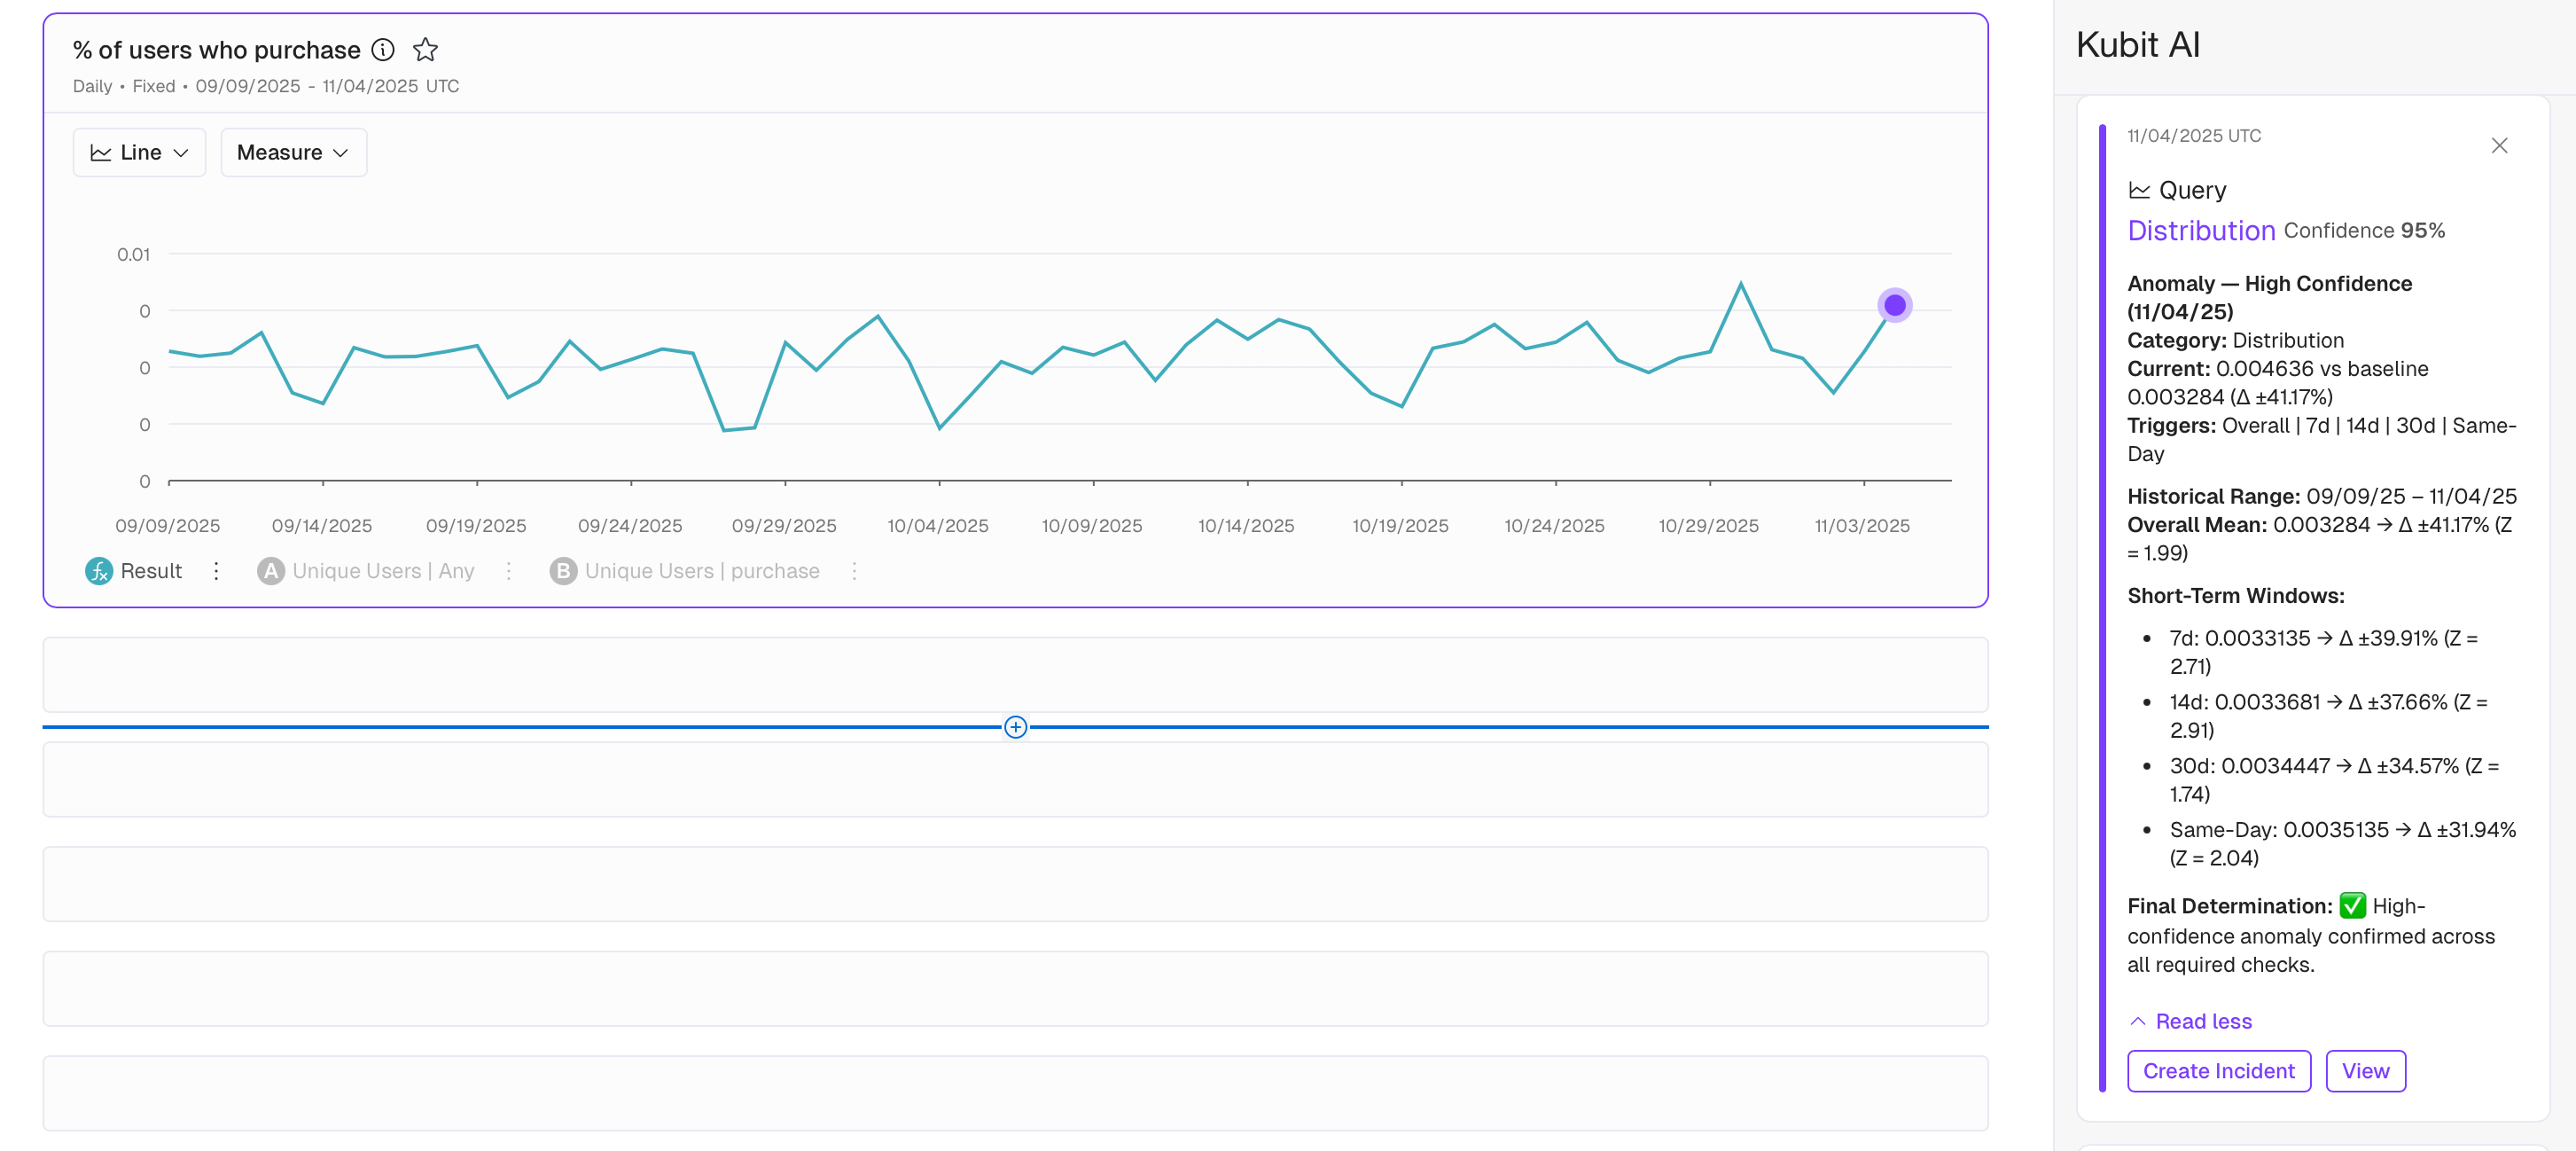
When deciding whether a data point is an Anomaly Kubit is considering not only all the data contained in the Report but also:
- 7, 14 and 30 day means, same day of week mean (for Reports with
Time Unit = Daily) - for
Incrementalschedules all the Historical data is also taken into consideration when detecting an Anomaly for the new increment (see more about Incremental Mode here)
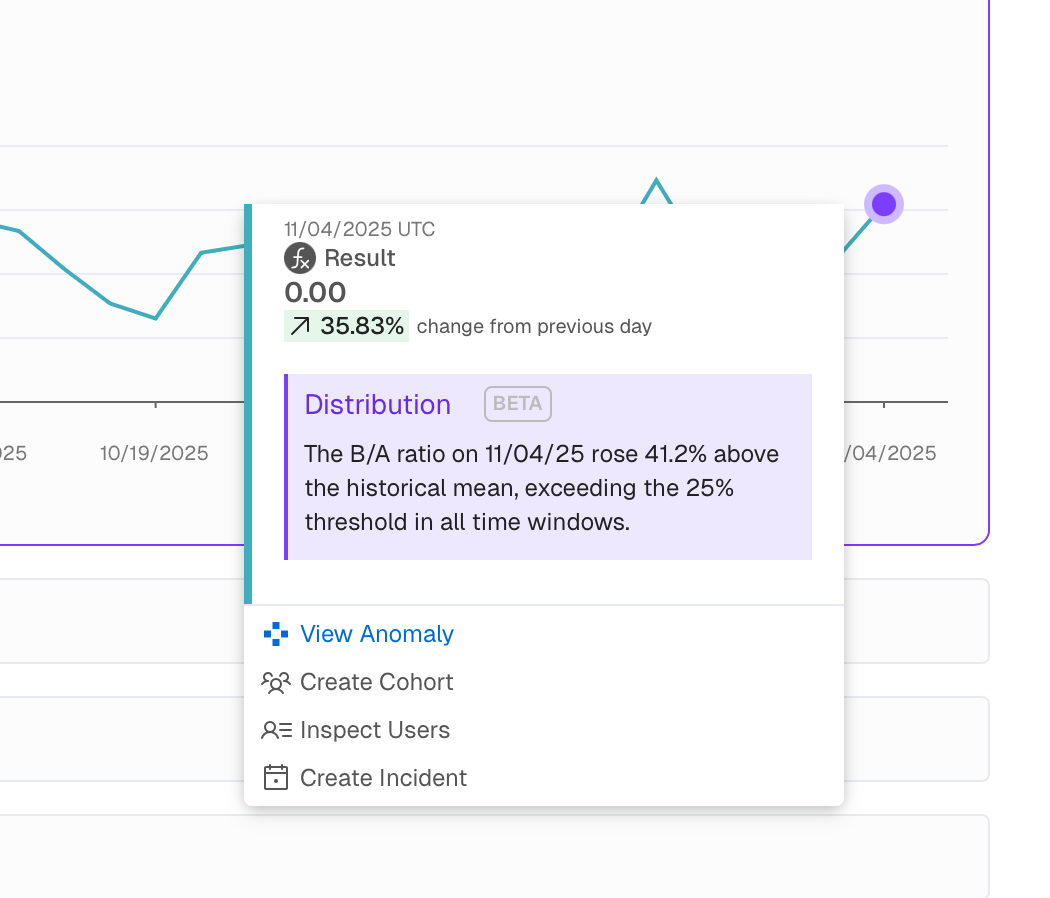
You can get a more detailed explanation on why a certain data point was considered an anomaly by left-clicking on the purple dot and then selecting View Anomaly. You will see parameters such as Confidence, Triggers and the MAD or Z-score.
Alerts
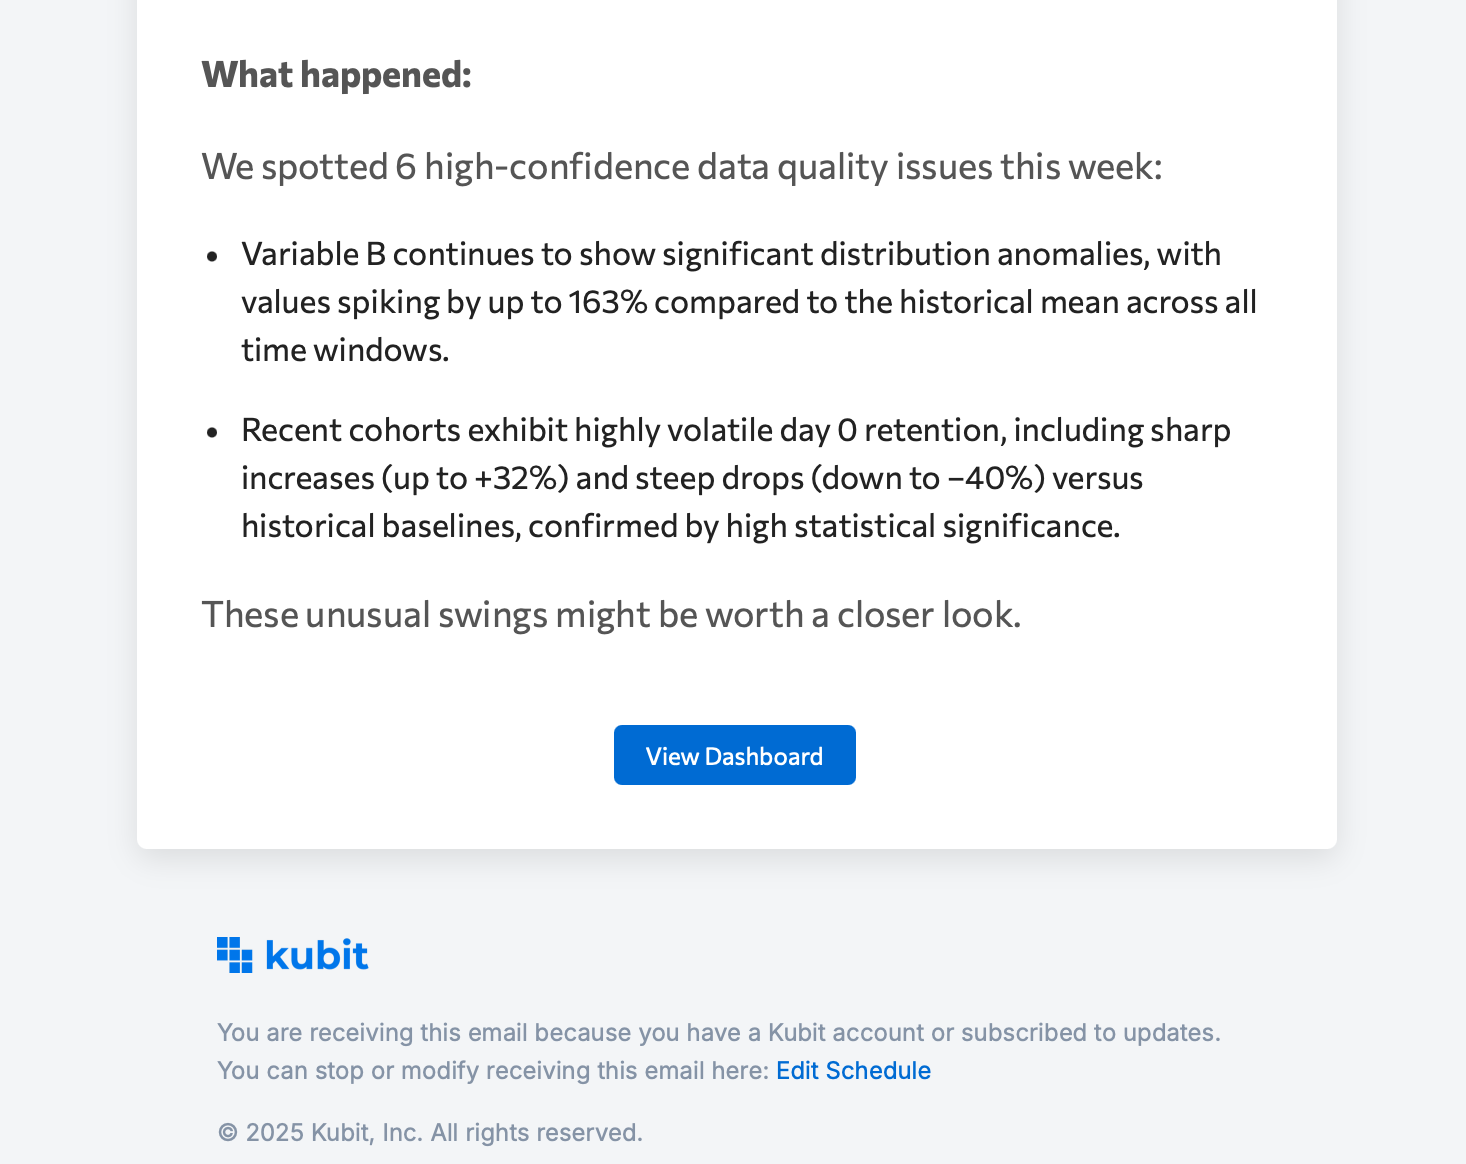
Whenever Kubit detects data issues when executing a Schedule it will send out a short summary in the Alert email/Slack notification with the detected issues.
Kubit will send only one alert for each issue. If the same issue is detected again during the next Schedule execution no new alert will be sent in order to reduce noise.
Here's an example snippet from the anomaly summary you'll receive below the Dashboard/Report screenshot in the alert email:
Manage Anomalies
The list of Anomalies will keep growing on the right side of the Dashboard. You can Archive issues so the next time you and your team look at the Dashboard you can focus on only the latest anomalies.
Alternatively, you can also Create Incident from an Anomaly. Here's a quick link to the Incidents reference.
Anomaly Detection Settings
Depending on the nature of your business we can further fine-tune how Anomalies are detected from by selecting the appropriate Detect mode for you:
Include only weekdays- can be selected in case your users' activity is during working days mostly (e.g. for enterprise software)Include all data- for everything else
If you think the wrong mode is being used ask your CSM to make this change for you.
Custom Alert Monitors in Query
When a Query is monitoring critical KPIs it's important to be alerted when a measure or compound measure dips below or above a certain threshold. Previously Kubit detected these anomalies using our own model but now you are able to set thresholds yourself!
Only available on Query Report type schedulesThis is NOT available for Dashboards or other Report types.
When creating a schedule for the Query report, follow the same flow of:
- Naming the Schedule.
- Setting the refresh timeframe.
- Adding recipients to the emails of that Report and any Alerts.
The newly added functionality allows you to set thresholds of when an alert will fire on a given day.
- Click "Custom Threshold Met".
- Input the parameters, meaning if any value on the chart is Above/Below a specific number.
- You can also set Alerts based on percent change from the previous day by adding a Comparison Analysis to your query.
Incremental Mode
When a report is executed, it is run for the entire specified time range. This may be inefficient if the older data does not change, and does not necessarily need to be re-run. Setting the report schedule to Incremental Mode addresses this.
What is Incremental Mode?
- Incremental Mode allows users to generate data for smaller time ranges (e.g., one month), rather than executing the same report over longer periods (e.g., one year), which can take more time to execute.
- With Incremental mode, users can run reports for individual time slices, and the system will merge the results into a single view.
- When a report is scheduled as Incremental, each run captures data for a specific period, enabling aggregation into a unified chart over time.
When to use Incremental Mode?
Incremental Mode is best used when dealing with large datasets. Especially in combination with one of the following:
- You're looking at a date range with
Sincelogic and you want the start date to remain static but each new day of data to be added as it's refreshed. - You're reporting on large date ranges with the
Time Unitset toMonthly,Quarterly, orYearlyand you don't want to re-run the entire report, just the new time periods. - You are looking at data that doesn't change historically and do not need a fully refreshed report, just the latest increments of data.
Updated 6 months ago