Data Table
Build pivot-style reports with saved measures and up to five breakdowns to view aggregated metrics side-by-side and compare data across multiple dimensions.
Data Table provides a pivot table visualization for tabular reporting. Simply add your Measures and Compound Measures to provide the calculation values, then pivot based on Breakdowns and Segments.
Watch our Data Table Training Video
Use Cases for Data Table:
- Only interested in measures aggregated and side by side, no lines/bars.
- Allows for multiple breakdowns (up to 5) similar to a Pivot Table in Excel or Tableau.
- See ALL the data.
Building a Data Table
Data Table is similar to Query in that it's made of Measures, Compound Measures and the standard filters/breakdown/segments.
- Build the Measures you want to see aggregated directly within the data table.
- If you want to create a separate measure similar to the one you have, you can easily duplicate and then change the parts you want.
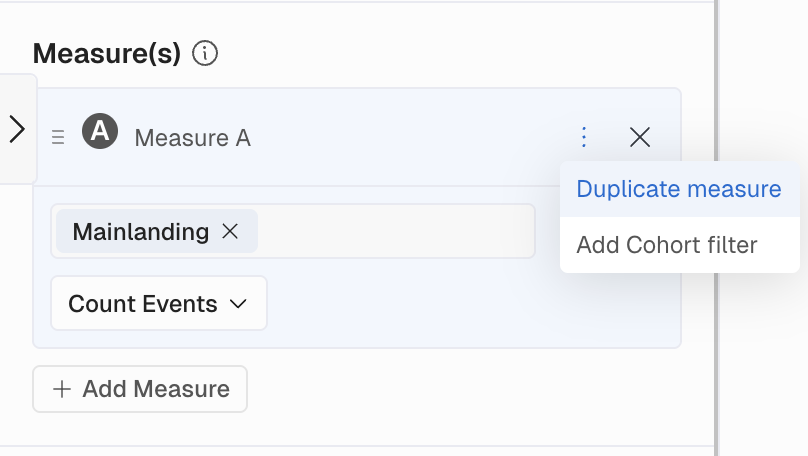
- Select Saved Measures by clicking "Measure Options" and then "Add Named Measure" and select the one you want to use.
Use Query to build Compound MeasuresNote that you are only able to build Compound Measures in Query. Once you Save them you'll be able to select them in Data Table.
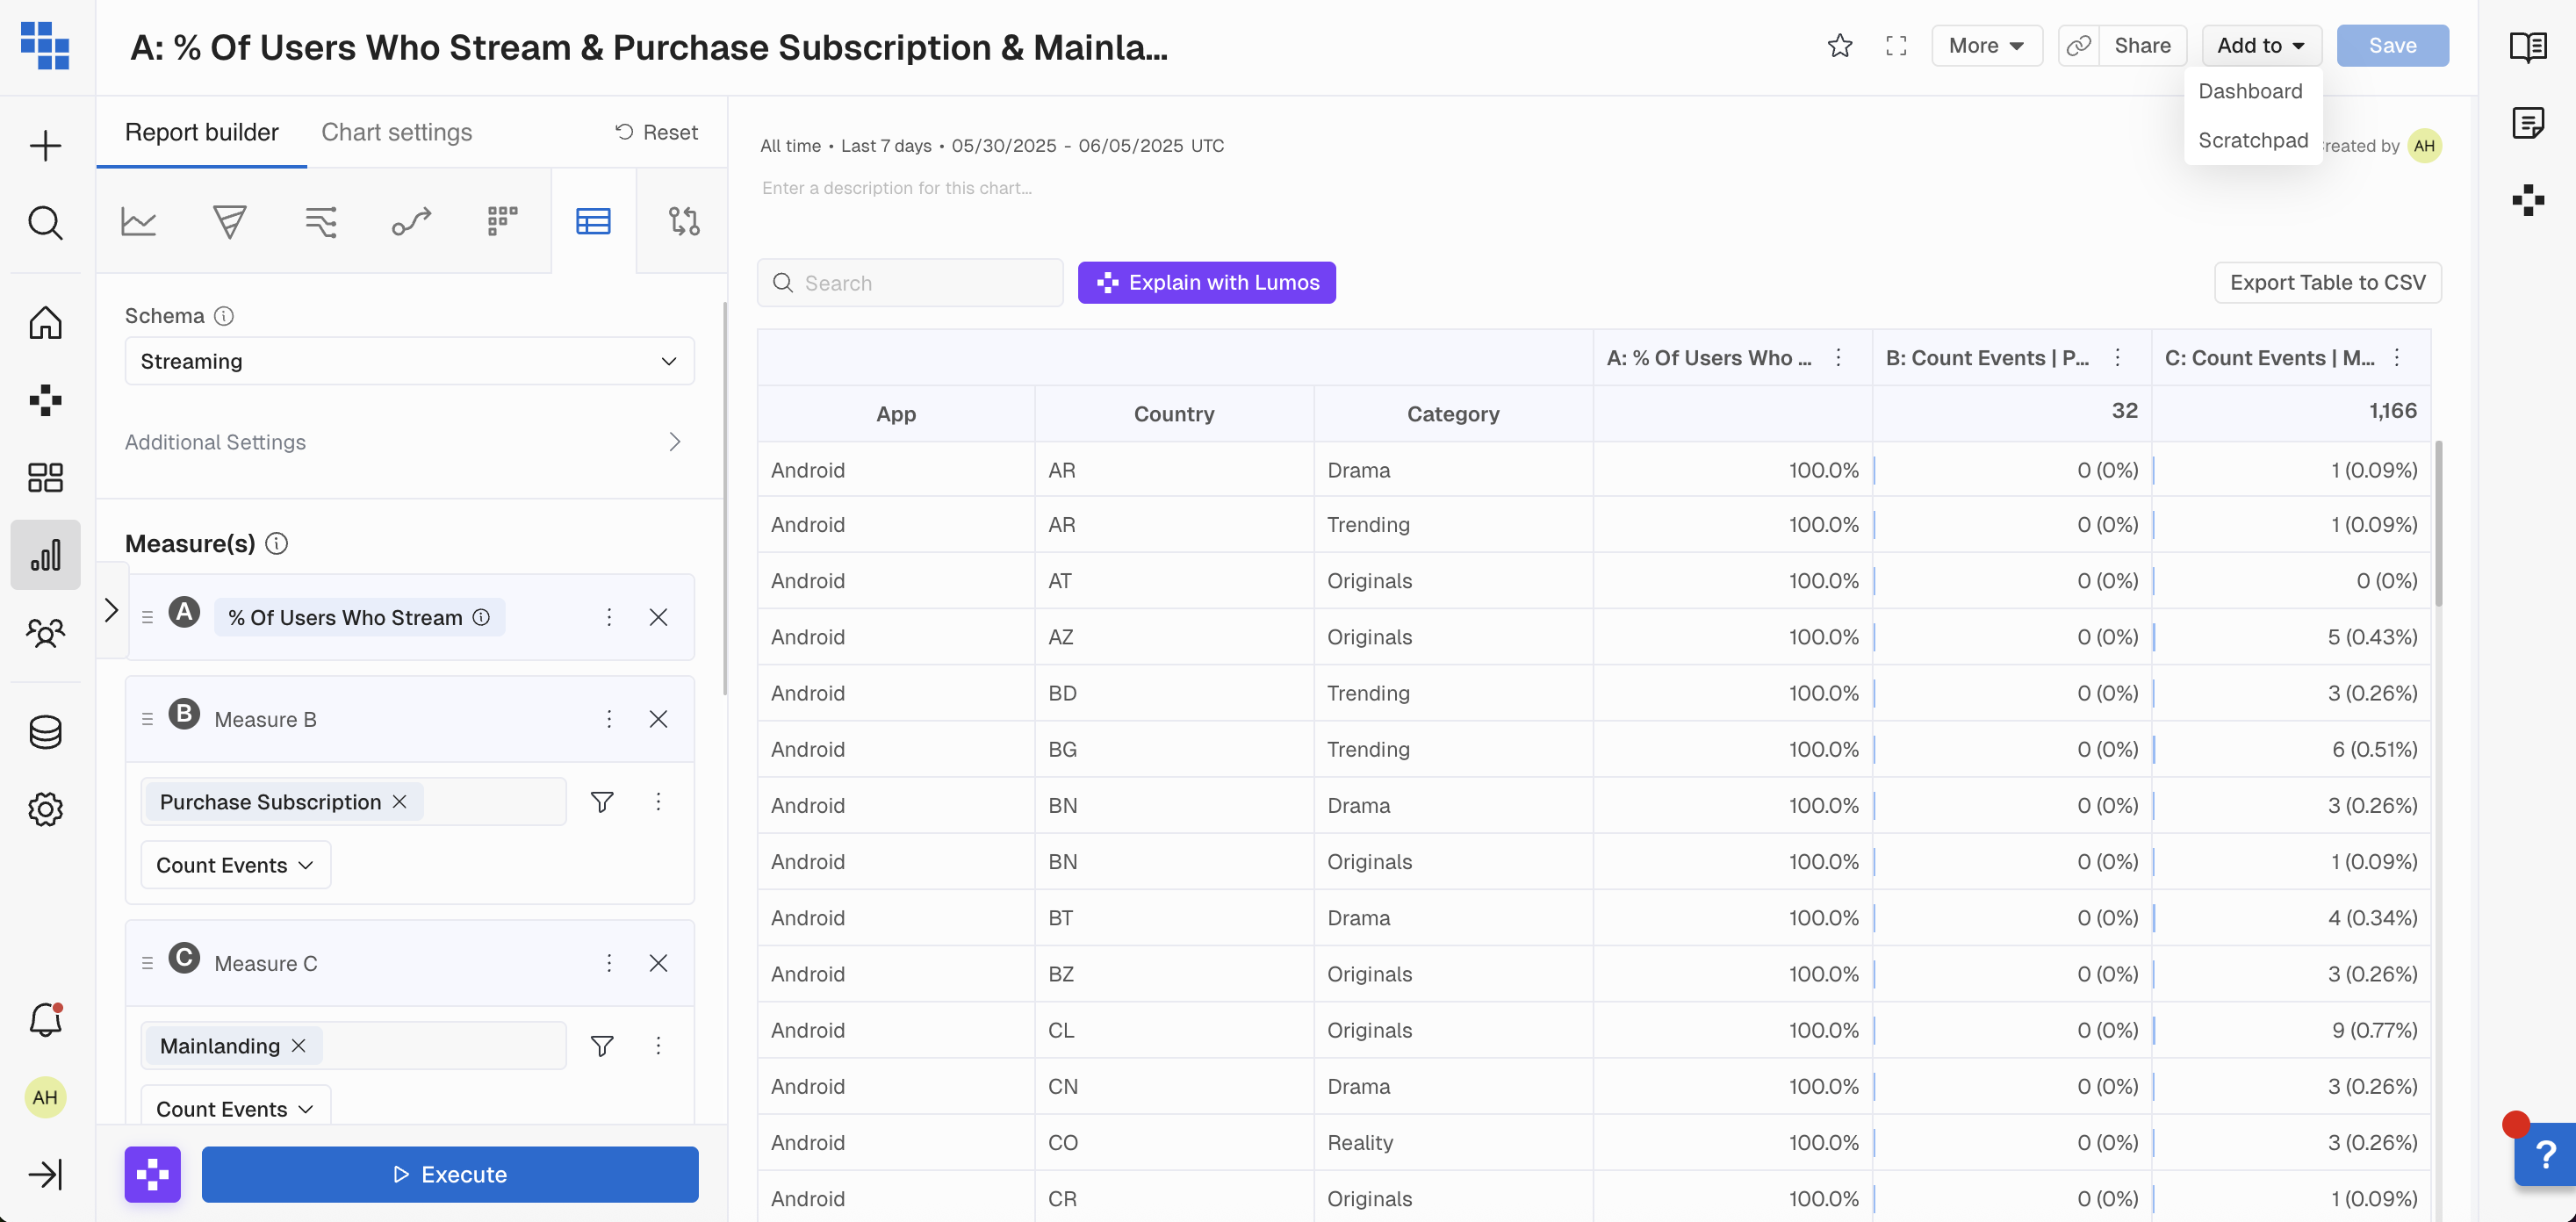
Data Table Results
Once executed the result will be a pivoted view of:
- Rows for each breakdown group you've applied.
- Columns for each Measure you've selected.
- Additional columns for any Segments you've applied.
You are able to search, sort, and format the items within the Data Table. You can also Rename the columns to make sure it's clear what the Measure represents.
Compare in Data Table
In the Data Table report, you can compare a measure against its previous day, week, month, quarter, year, or another custom date range.
When constructing your Data Table:
- Select a Compare range next to your report date picker.
- Execute your report.
- You'll see a 'Previous' column containing the Compare date range data and a 'Current' column containing the report date picker data.
- You can also toggle on "Show % Change" above the table to visualize the change over time as a % with color formatting.
Additional Options
You are also able to:
- Add the Data Table to a Dashboard.
- Export the Table to a CSV.
- Reset any sort or search filters applied.
Data Table FAQs
When should I use a Data Table?
- Data Tables are great ways to aggregate data over periods of time, and compare metrics across various breakdown groups.
- If you want to see the aggregated metrics side by side for breakdown groups use a Data Table.
- If you want to see multiple Compound Measures you are able to add multiple Compound Measures on a Data Table.
When should I NOT use a Data Table?
- If you're goal is to view information trended over time it's better to use a Query report as that will show you data plotted over days, weeks, months etc.
- If you want to see data in a line, bar, pie chart, or stacked column you should use a Query report.
If you've build a Data Table and realized it's not what you need, click Next Steps which can be found right under the table results, and click on a Query report to transition your selections into a Query builder. This will speed up your workflow and avoid you having to rebuild everything and flexibly move from report types.
Updated 6 months ago