Significance
Understand the statistical impact of experiments or segments.
Understanding Significance
Kubit’s Significance Report provides statistical insights to determine if a finding in a Measure, Query, Funnel, or Retention is significant—meaning whether a result is likely due to chance or a specific factor of interest.
NoteThis feature is available for Measure, Query, Funnel, and Retention Reports. It is not supported for Flow, Data Table, or Cohort Compare reports.
This tool is versatile and does not require formal A/B testing. You can use it to analyze experiment data or compare any two groups, such as breakdowns or segments, as if they had different treatments.
Steps to Create a Significance Report:
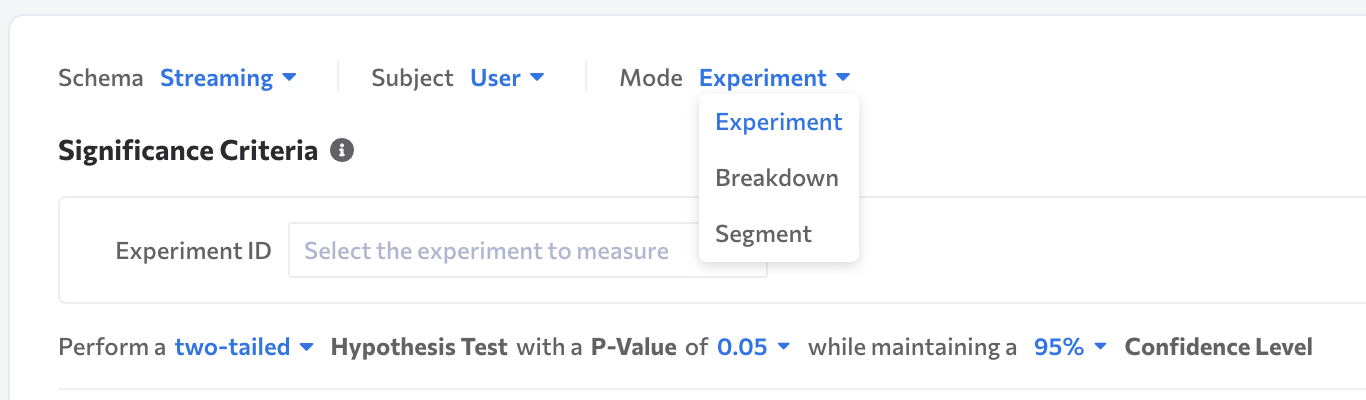
- Select the Mode: Choose the mode for your analysis. Options include Experiment, Breakdown, or Segments.
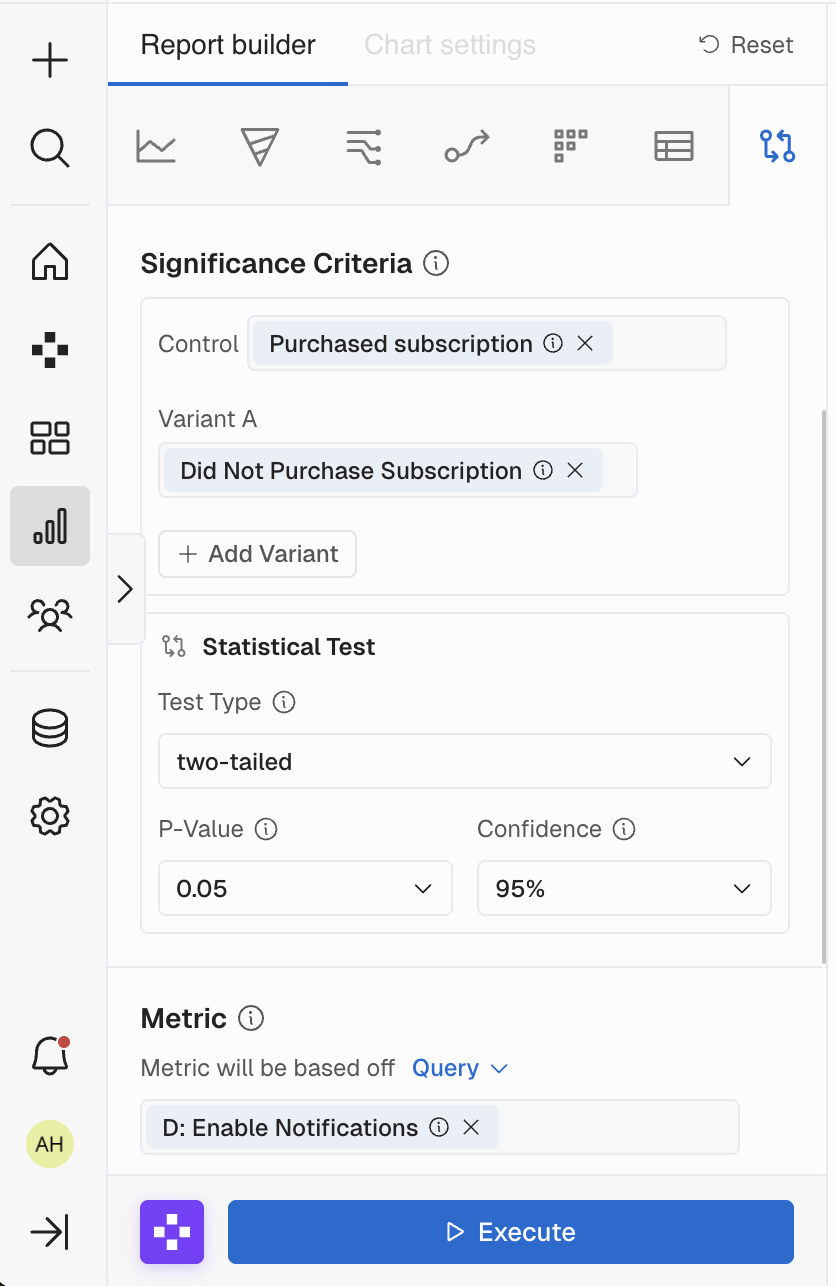
- Identify Control and Variants: Determine the groups you will analyze.
- Set Parameters: Choose additional parameters like one or two-tailed tests, p-value, and confidence intervals.
- Select the Metric: Decide on the metric to analyze the lift between your Control and Variants.
- Choose Reports: You can select from Saved Measures, Query, Funnel, and Retention reports.
- Apply Filters and Date Range: Use filters if needed and set your desired date range.
- Execute the Report: Run the analysis to view statistical insights.
Upon execution, you will see all relevant statistical information.
Significance Modes
Kubit’s Significance Report allows you to analyze data in three ways:
- Experiment Mode: Analyze metrics based on Experiment IDs and Variant IDs shared with Kubit. This mode is available for customers who have shared specific experiment data.
- Breakdown Mode: Analyze metrics based on a field and its values. Ideal for fields that denote different experiences or experiments.
- Segment Mode: Analyze metrics based on user cohorts. Best for users assigned to experiments or experiences via a single event.
Experiment Mode
This mode is available for customers with Experiment ID and Variant ID fields mapped to users. If your data is mapped to specific events, consider using Segment Mode.
Breakdown Mode
Use this mode to measure lift from dataset values like User Type, Platform, or Country. You can add more variants if your breakdown value has more than two groups.

Segment Mode
Segment users based on their presence in a Saved Cohort. Ensure cohorts are saved to appear in the Segment Mode dropdown.
Additional Options
Customize your analysis with these options:
Hypothesis Test
- One-Tail Test: Looks for an effect in one direction.
- Two-Tail Test: Looks for an effect in both directions.
P-value
- Description: Indicates the likelihood of observing the data if the null hypothesis is true.
- Interpretation: A p-value less than 0.05 suggests statistical significance.
Confidence Level
- Description: Indicates the likelihood that observed differences are real.
- Interpretation: A 95% confidence level means 95% certainty that the true difference lies within the interval.
Metric Selection
Choose a metric relevant to your analysis. Ensure it is performed by enough users to yield significant results.
Metric Options
- Measure: Select from Saved Measures.
- Query: Choose from Queries that meet specific criteria.
- Funnel: Select from Funnels in Conversion or Time to Convert Mode.
- Retention: Choose from Retention curves in Retention Mode.
Considerations
- Kubit will overwrite dates in the original query with those selected in the Significance Report.
- Filters in the source Metric will apply to the analysis.
- Ensure sufficient sample size for accurate results.
Filtering and Date Range
Apply Global or Cohort Filters before analysis. Select a date range corresponding to your experiment duration. Results will be aggregated over the entire date range.
Interpreting Results
Results are displayed with detailed metrics available on hover. Add results to a Dashboard or Workspace.

FAQ
- Date Range: The date on a Report used as a Metric is overwritten by the Significance date.
- Cohort Filters: Cohort dates are retained.
- No Results: Ensure your sample size is large enough and your metric is not counting the subject of the significance report.
- Breakdowns/Segments: These in the report metric are ignored to avoid interactions with the Significance report.
Glossary
- Confidence level
- Delta
- Hypothesis test
- Lift
- Lift confidence interval
- Mean
- Test score for funnel
- Test score for query and retention and measures
- p-value
- Power
- Sample size
- Stat sig
- Standard deviation
Updated 6 months ago