Dashboards
Create interactive dashboards with multiple visualizations, set refresh schedules to monitor key metrics, and share insights across your organization with customizable filters and permissions.
Introduction
On a Dashboard, you can visualize results from multiple analyses simultaneously. The charts can be refreshed on a schedule to keep track of key metrics. You can create multiple dashboards that contain different charts. All the charts are interactive.
Watch our Dashboard Creation Training Video
Learn more about Dashboard Permissions and how you can collaborate with others when building dashboards.
How do I create a Dashboard?
There are two ways to create a Dashboard.
The first way to create a dashboard is to click the "+ New Dashboard" button. This Dashboard will automatically be saved to your "My Dashboards" section in the Sidebar.
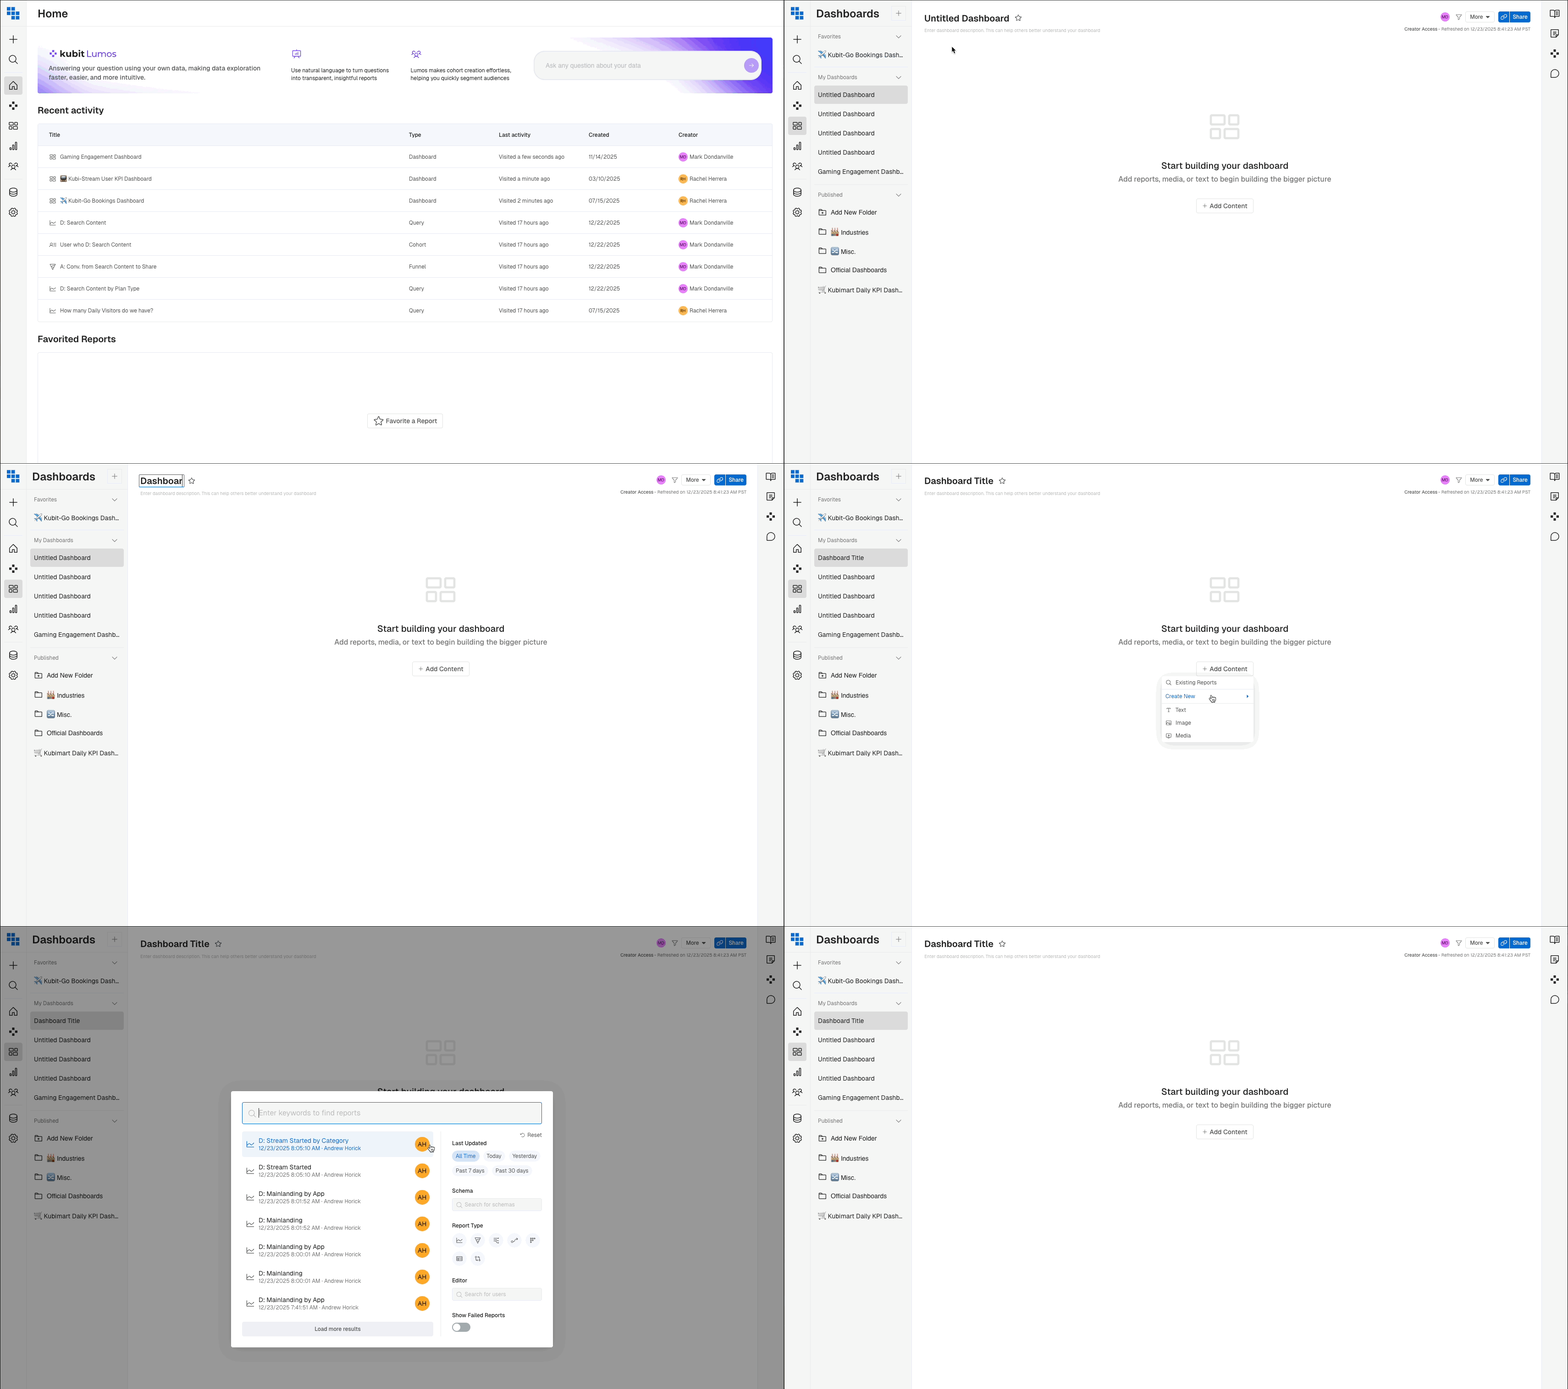
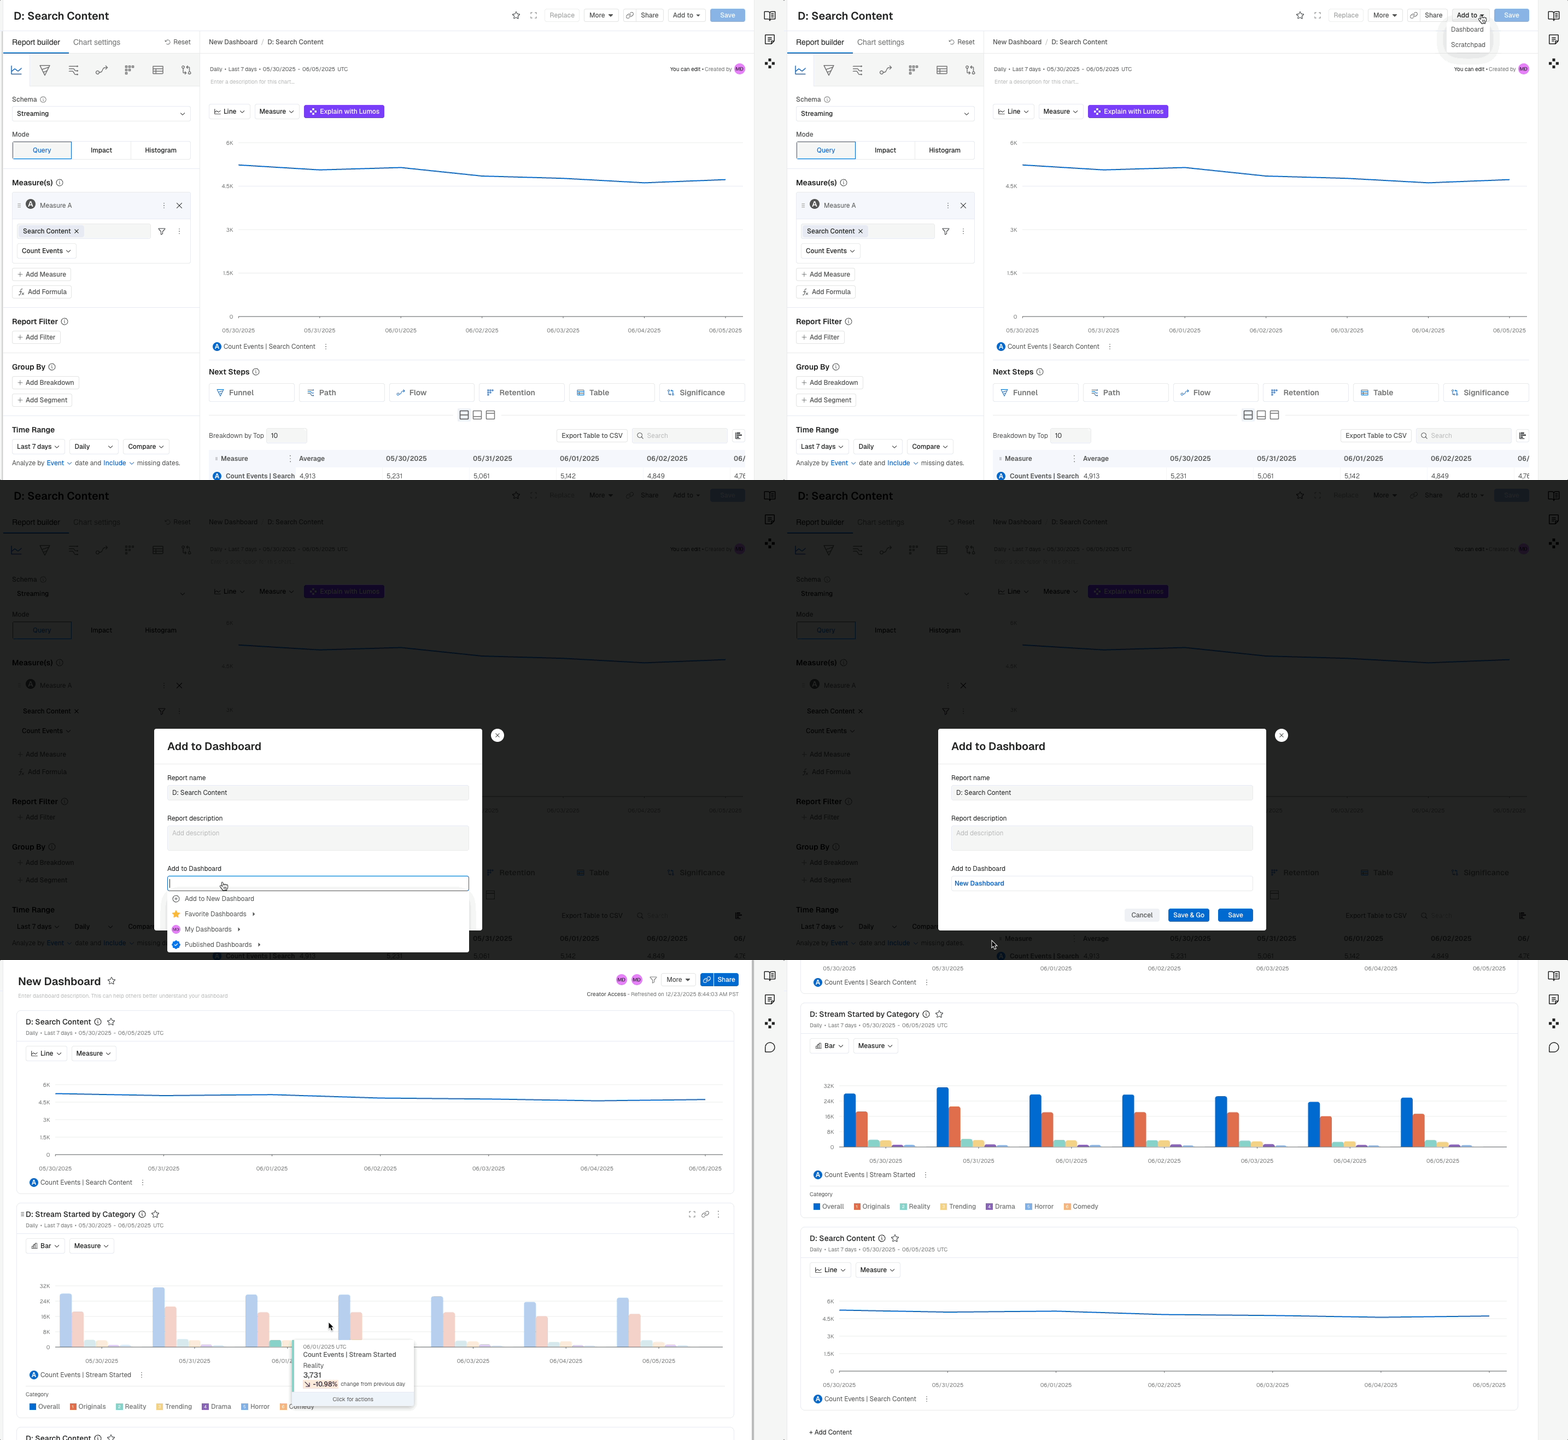
The second way to is when you make a report and want to add it to a Dashboard that doesn't yet exist.
- Once you've executed the report, click the "Add to" button in the top right of the report.
- Click Dashboard from the dropdown. Under the "Add to Dashboard" section at the bottom, select "Add to New Dashboard" and then "Save and Go".
- Now you have a dashboard with the report. It will be in your My Dashboards section, called "New Untitled Dashboard." You can rename it from the Dashboard's page.
Add Reports to a Dashboard
There are two ways to add a report to a Dashboard.
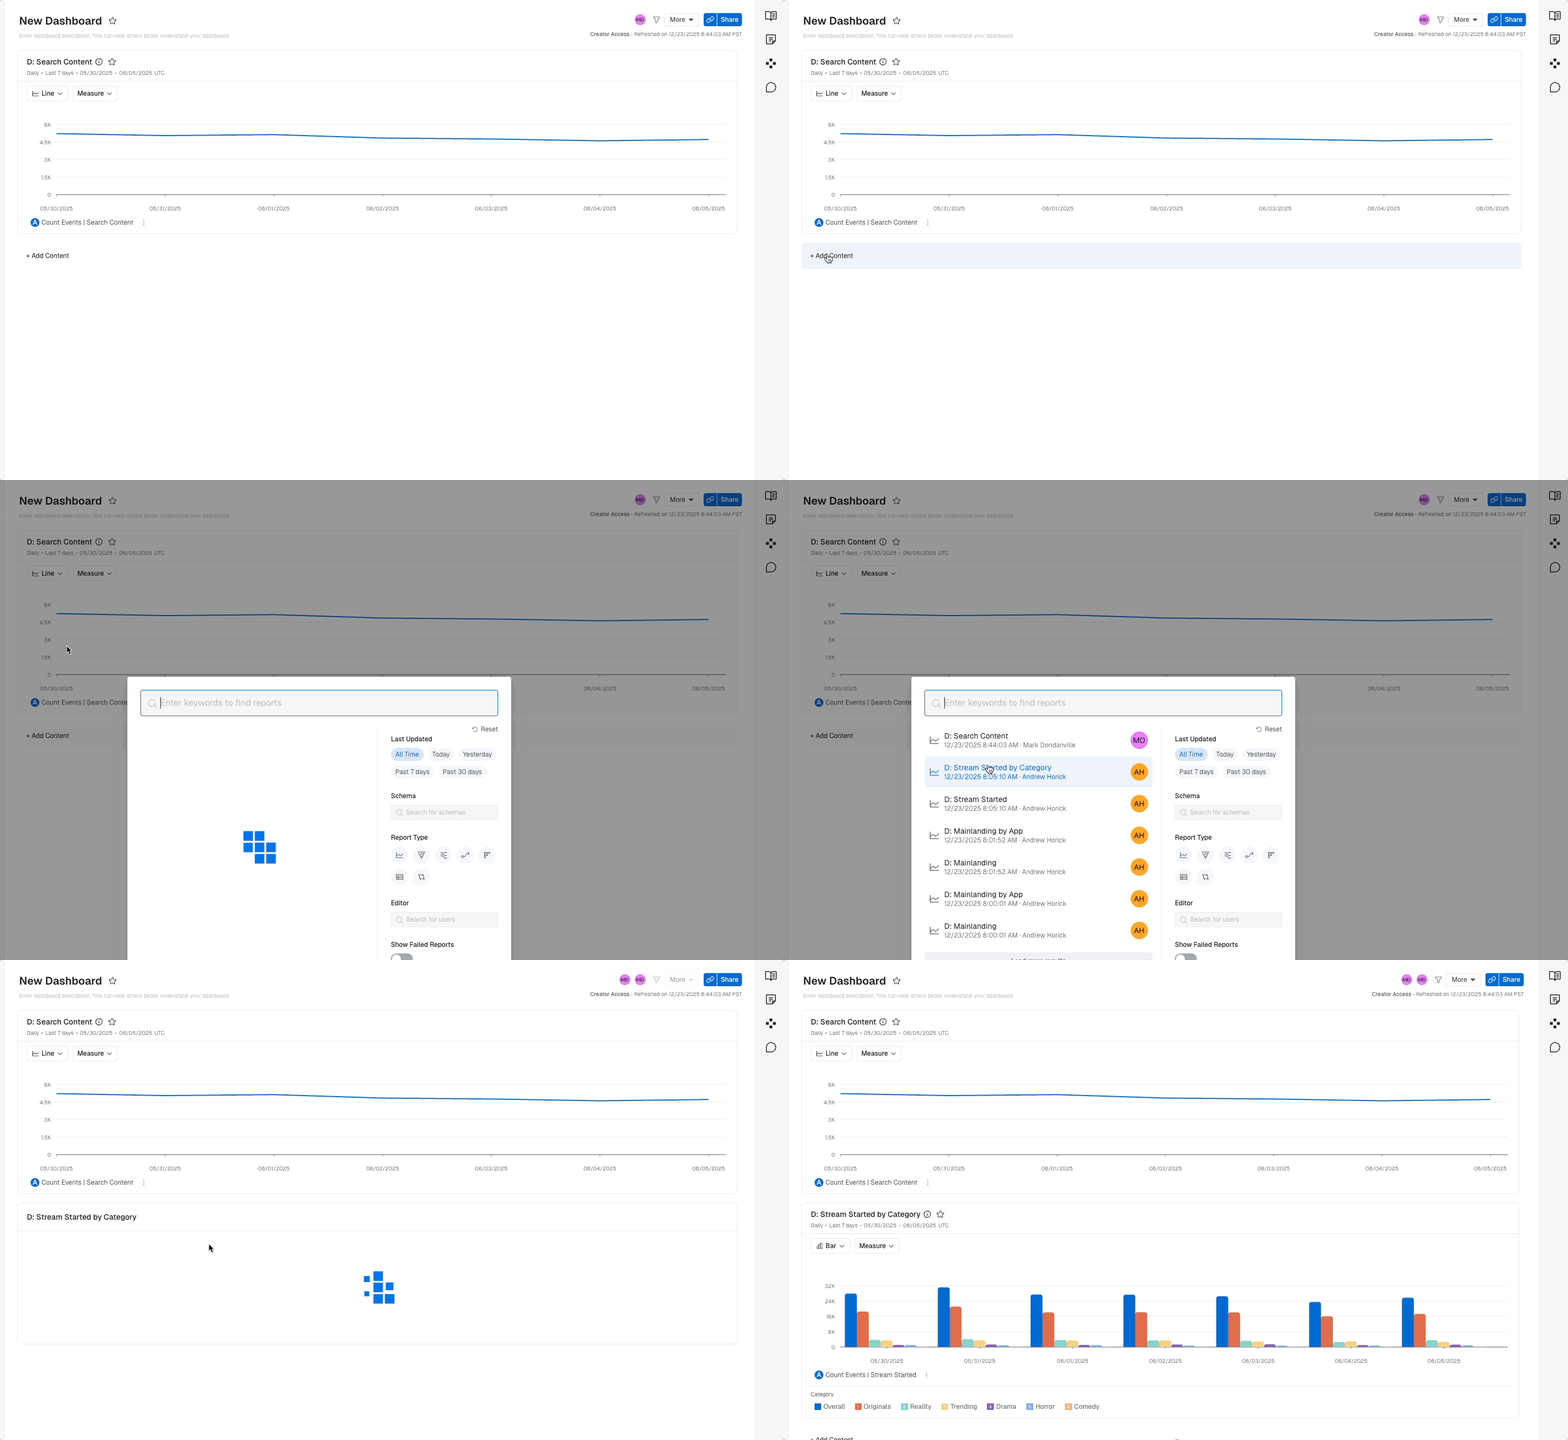
The first way is to use the "Add Content" section on the Dashboard. This allows you to add Text, Images, and Media, find existing Reports in Global Search, or jump directly to building a new Report of a specific type without leaving your dashboard.
The second way is to add an executed report to a dashboard by clicking "Add to" in the upper right corner of the report visualization.
- Once you've executed the report click the "Add to" button in the top right of the report.
- Update any settings on your report then click "Add to" and select Dashboard.
- Modify the report name, add a description, and then search for the dashboard you want to add this report to.
- Click the dashboard you want to add your report to.
- Click "Save" to add it and stay in your workflow. Alternatively, you can click "Save & Go" to be taken to your dashboard with the report added.
Delete Reports From a Dashboard
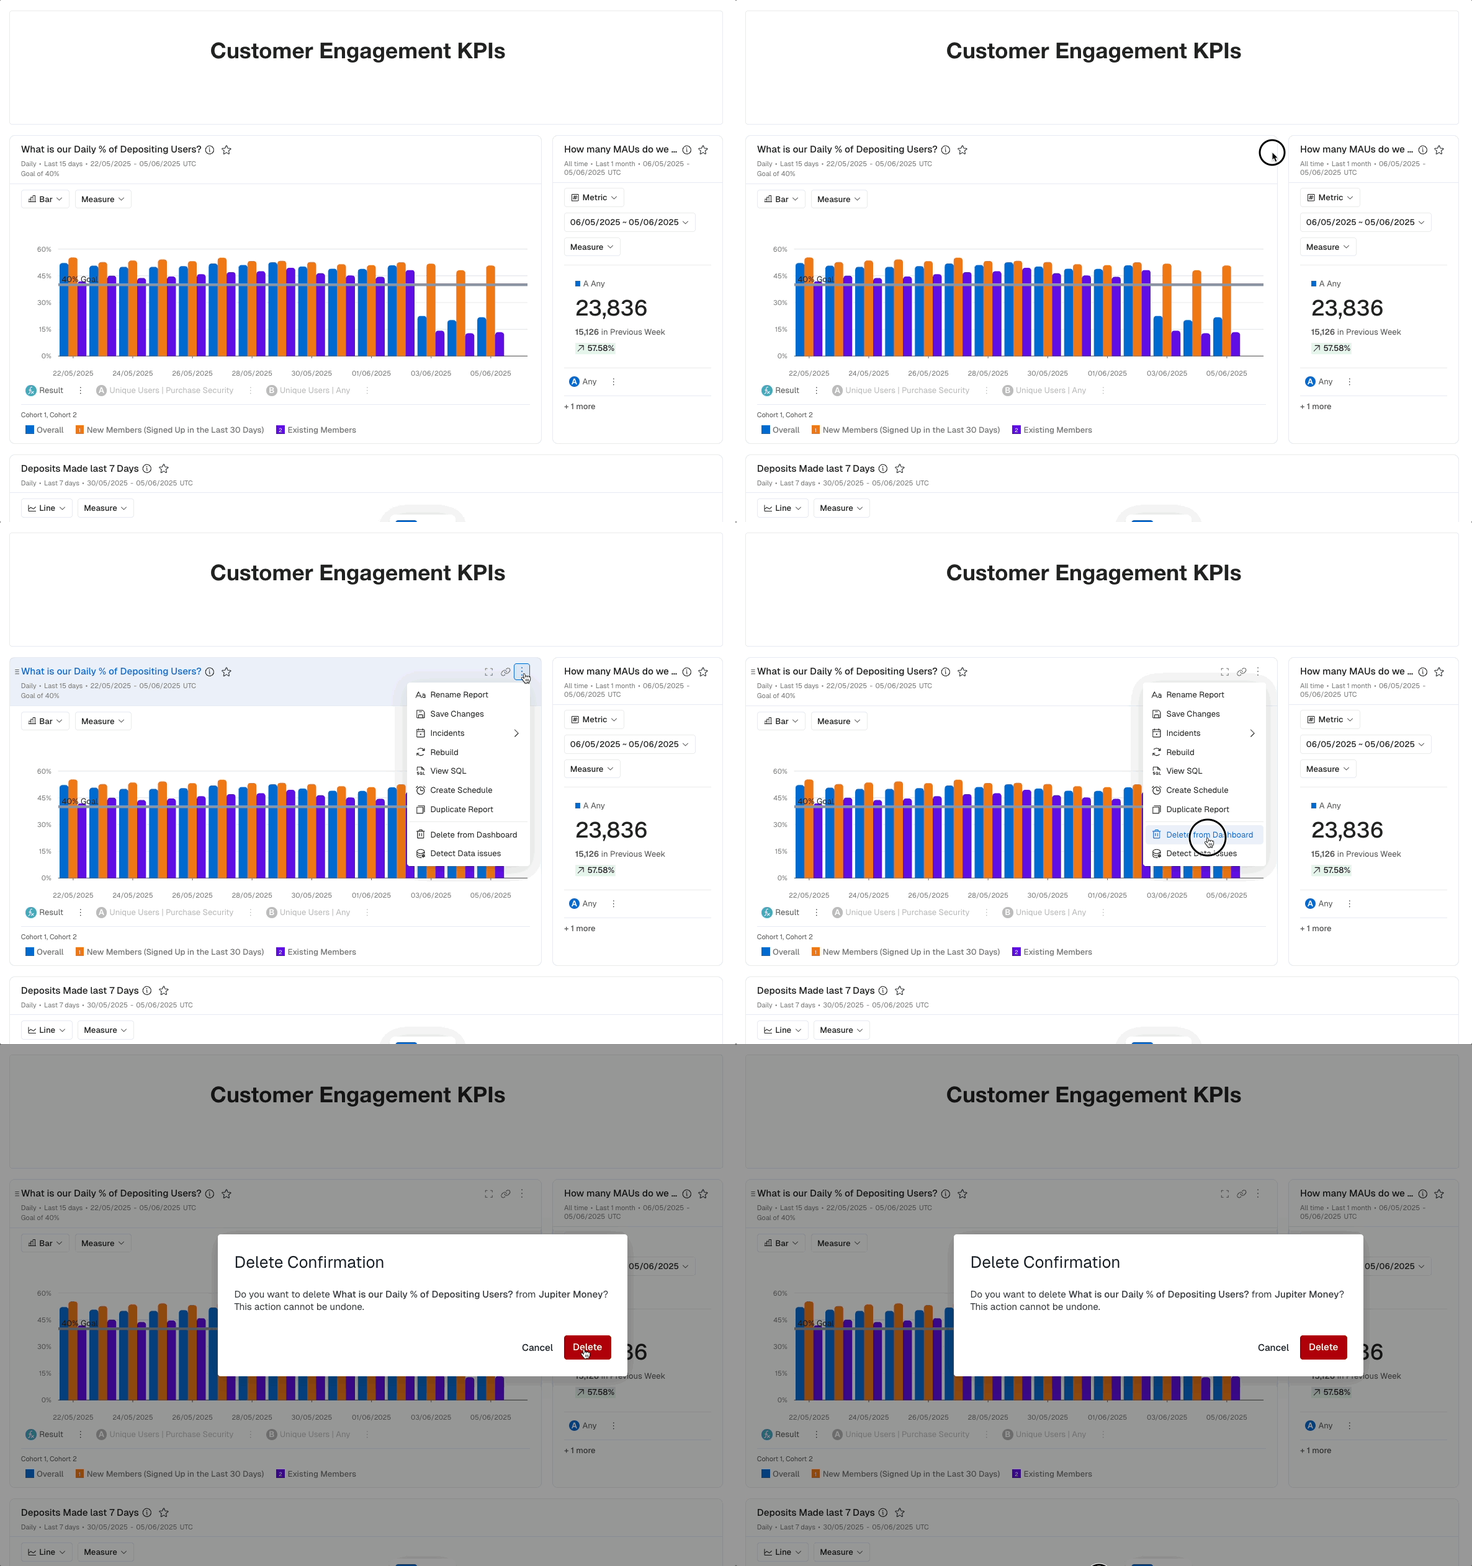
To delete a report from a Dashboard open the Chart's Context (three dot) menu and select Delete from Dashboard. Select Delete from the Delete Confirmation dialog box to confirm.
Change the layout of a Dashboard using drag-n-drop
All charts on a Dashboard can be grabbed by the three-line icon in their top left corner. They can be dragged and dropped into new columns or rows. You can only rearrange a Dashboard if you have Editor, Manager, or Owner access.
Limitation on how many charts in a rowYou can put up to three Charts in a row.
Add Rich Text to your Dashboard
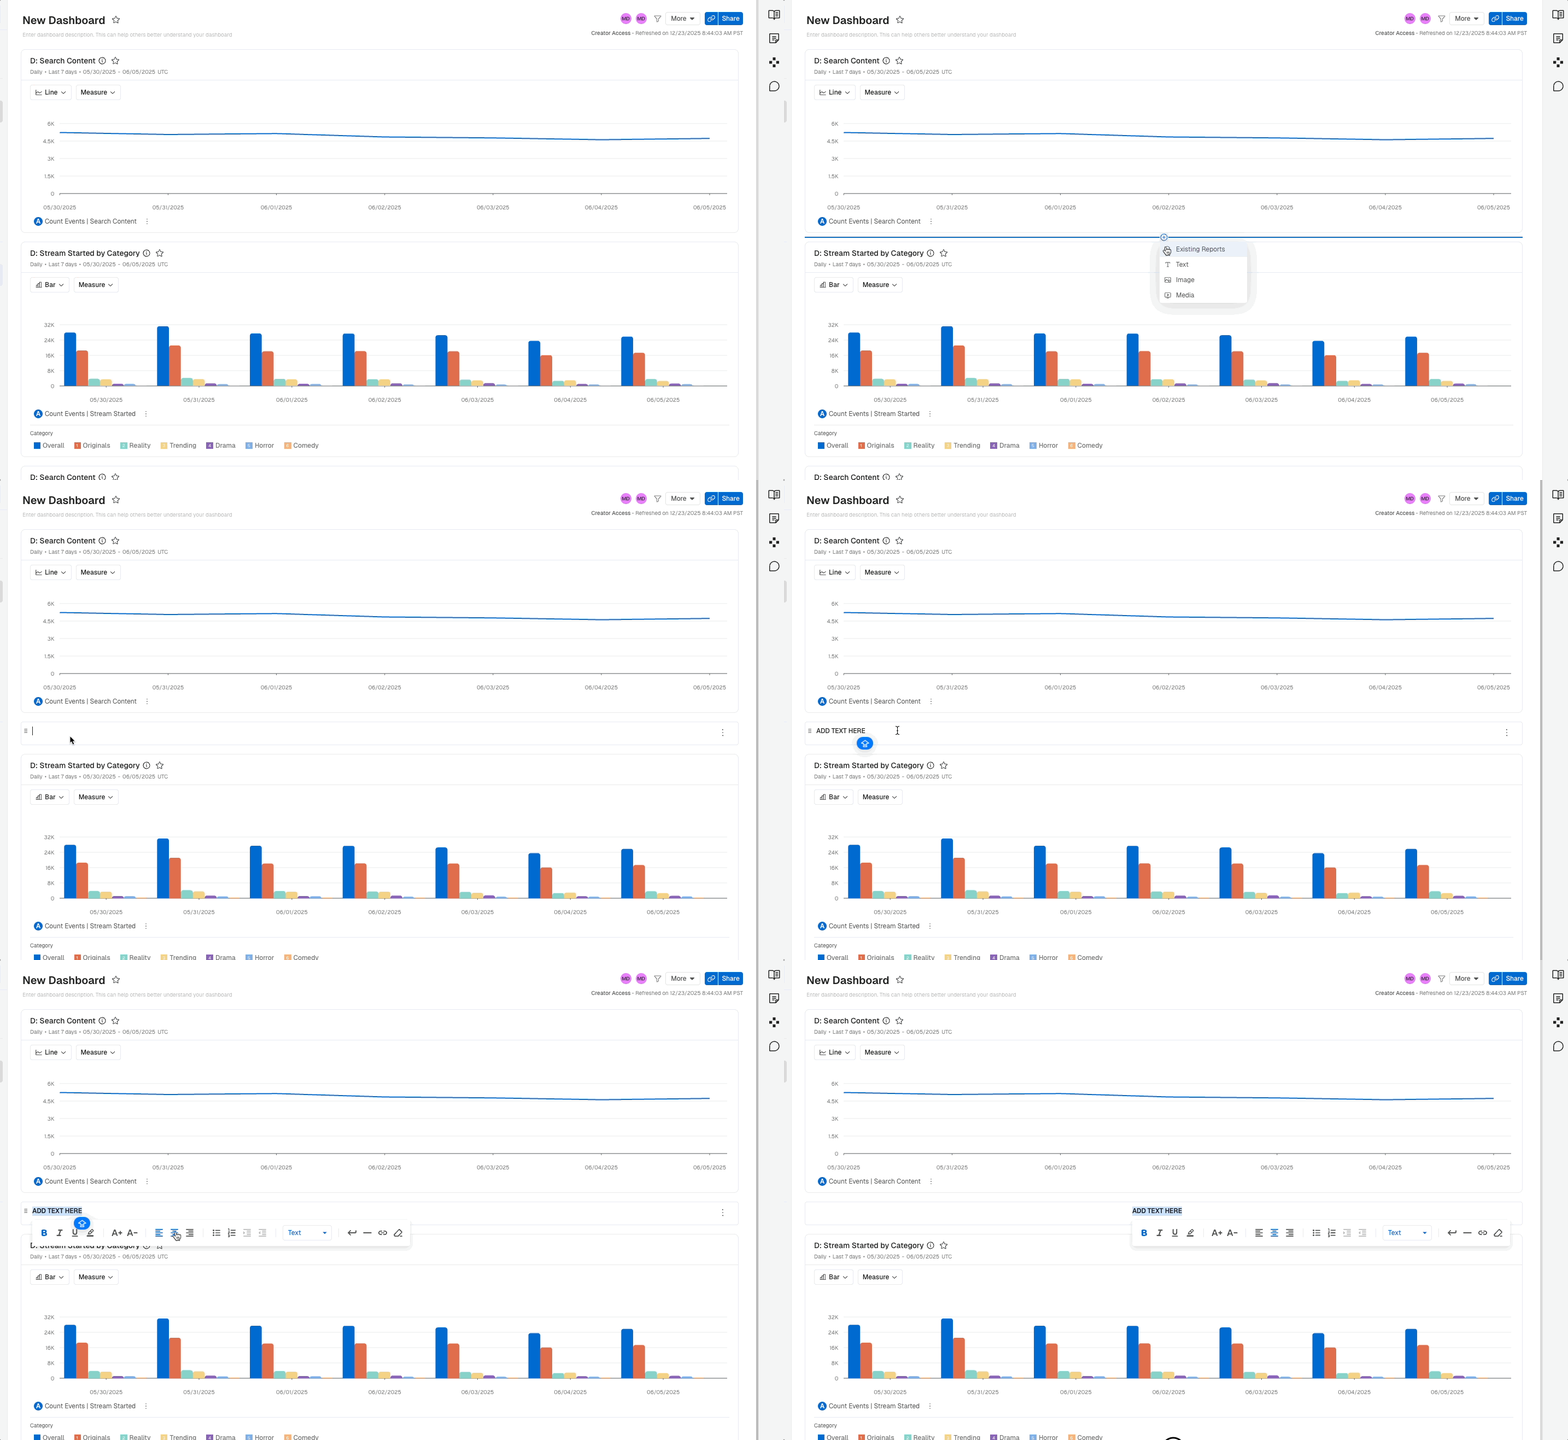
You can add Rich Text to your dashboard. This includes font size, bolding, italicizing, underlining, highlighting, line alignment, bulleted and numerical lists, indentation, headers, and hyperlinks.
To add rich text to your dashboard:
- Hover over the "+" that appears between the reports and select "Text"
- A new item will appear on the dashboard which you can type in.
- Rich Text bubbles can be moved around the dashboard like Reports.
Add Media to your Dashboard
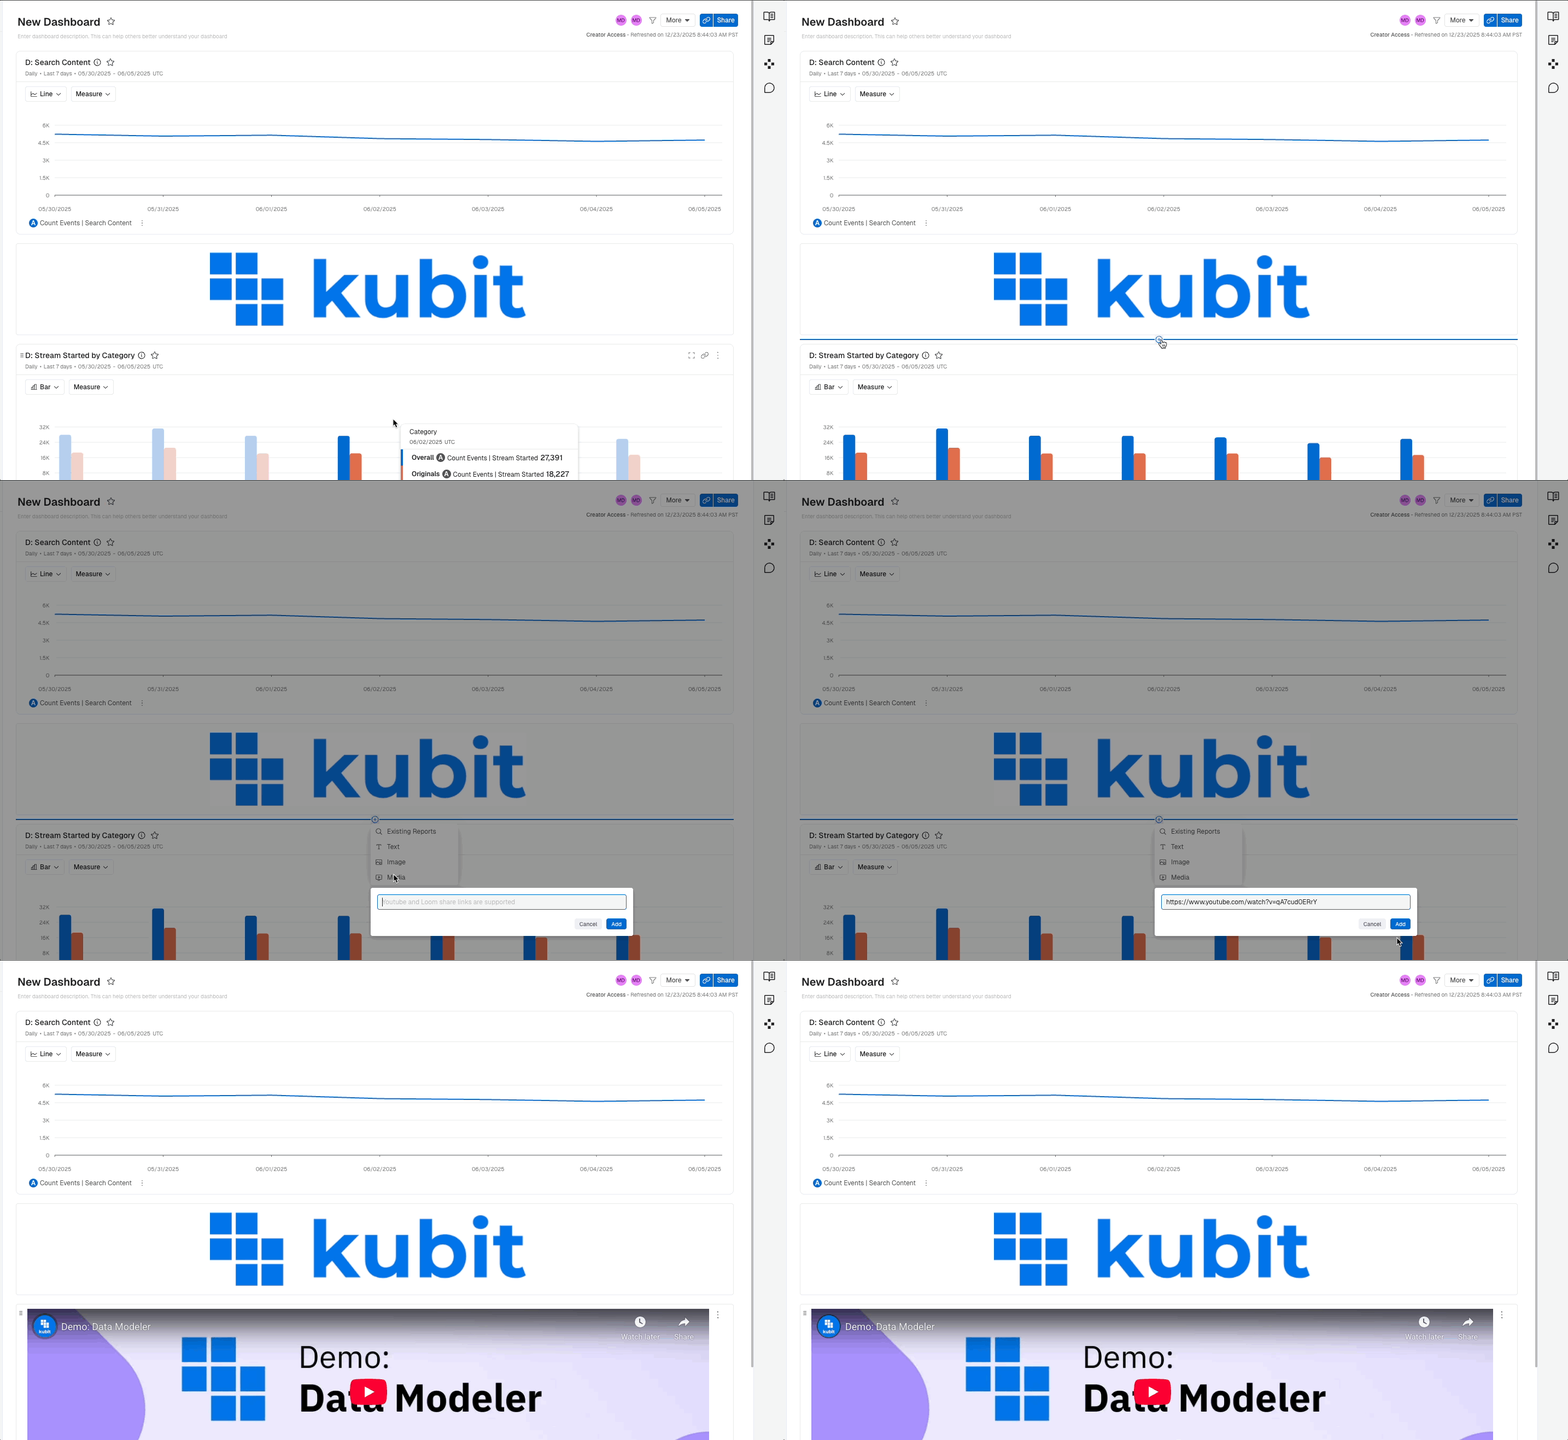
Static images and video can be added to a Kubit dashboard.
Add Images to a Dashboard
You can add gifs or static pictures to your Dashboards.
To add media to your dashboard:
- Hover over the "+" that appears between the reports and select "Media".
- A folder browser will open and you can select your image.
- The media will be added to the dashboard and can be moved and resized as needed.
Add Videos to a Dashboard
Media from Loom and YouTube can also be embedded onto Dashboards. This feature gives you the flexibility to continue to put relevant content at the forefront of Dashboard design.
To embed videos on your dashboard:
- Hover over the "+" that appears between the reports and select "Media".
- A text box will appear where you can paste the URL.
- The video will be embedded on your dashboard and can be resized and moved as needed.
Setting Dashboard Filters
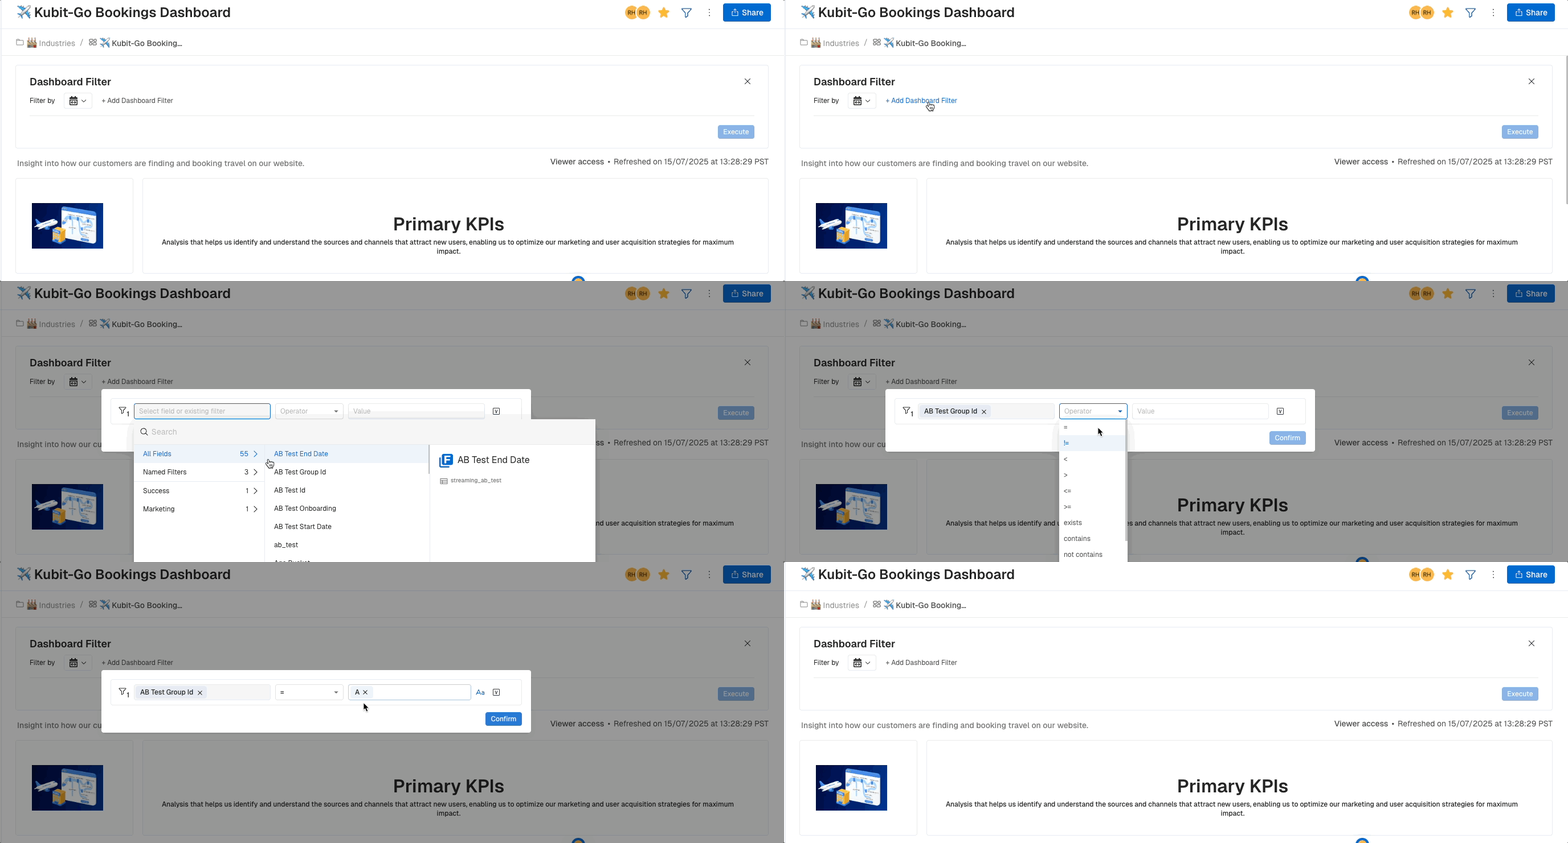
When adding Dashboard Filters, an Owner, Manager, or Editor can Set Filters to the Dashboard. Simply click on the funnel icon to create a filter. It sits just to the left of the "More" dropdown.
Filter Types
There are 2 types of filters you can add:
Date Filter- This will always appear when you start creating filters. If you don't use a date filter, the dates in each report will stay was they were when the report was created.

Field Filter - Setting this type of filter is accomplished by adding Fields, choosing the "Any" option, and then selecting Set Filters. This creates a template for any Dashboard users.
Users can then go into the Dashboard and specify the values to use in the Filter without needing to hunt and find ones that work.

Considerations
- Viewers of a Dashboard can not Set Filters, they can still create and run regular Filters on a Dashboard.
- Field filters are only available if each Report in the Dashboard belongs to the same Schema.
Tutorial
Change Your Report Visualization Type
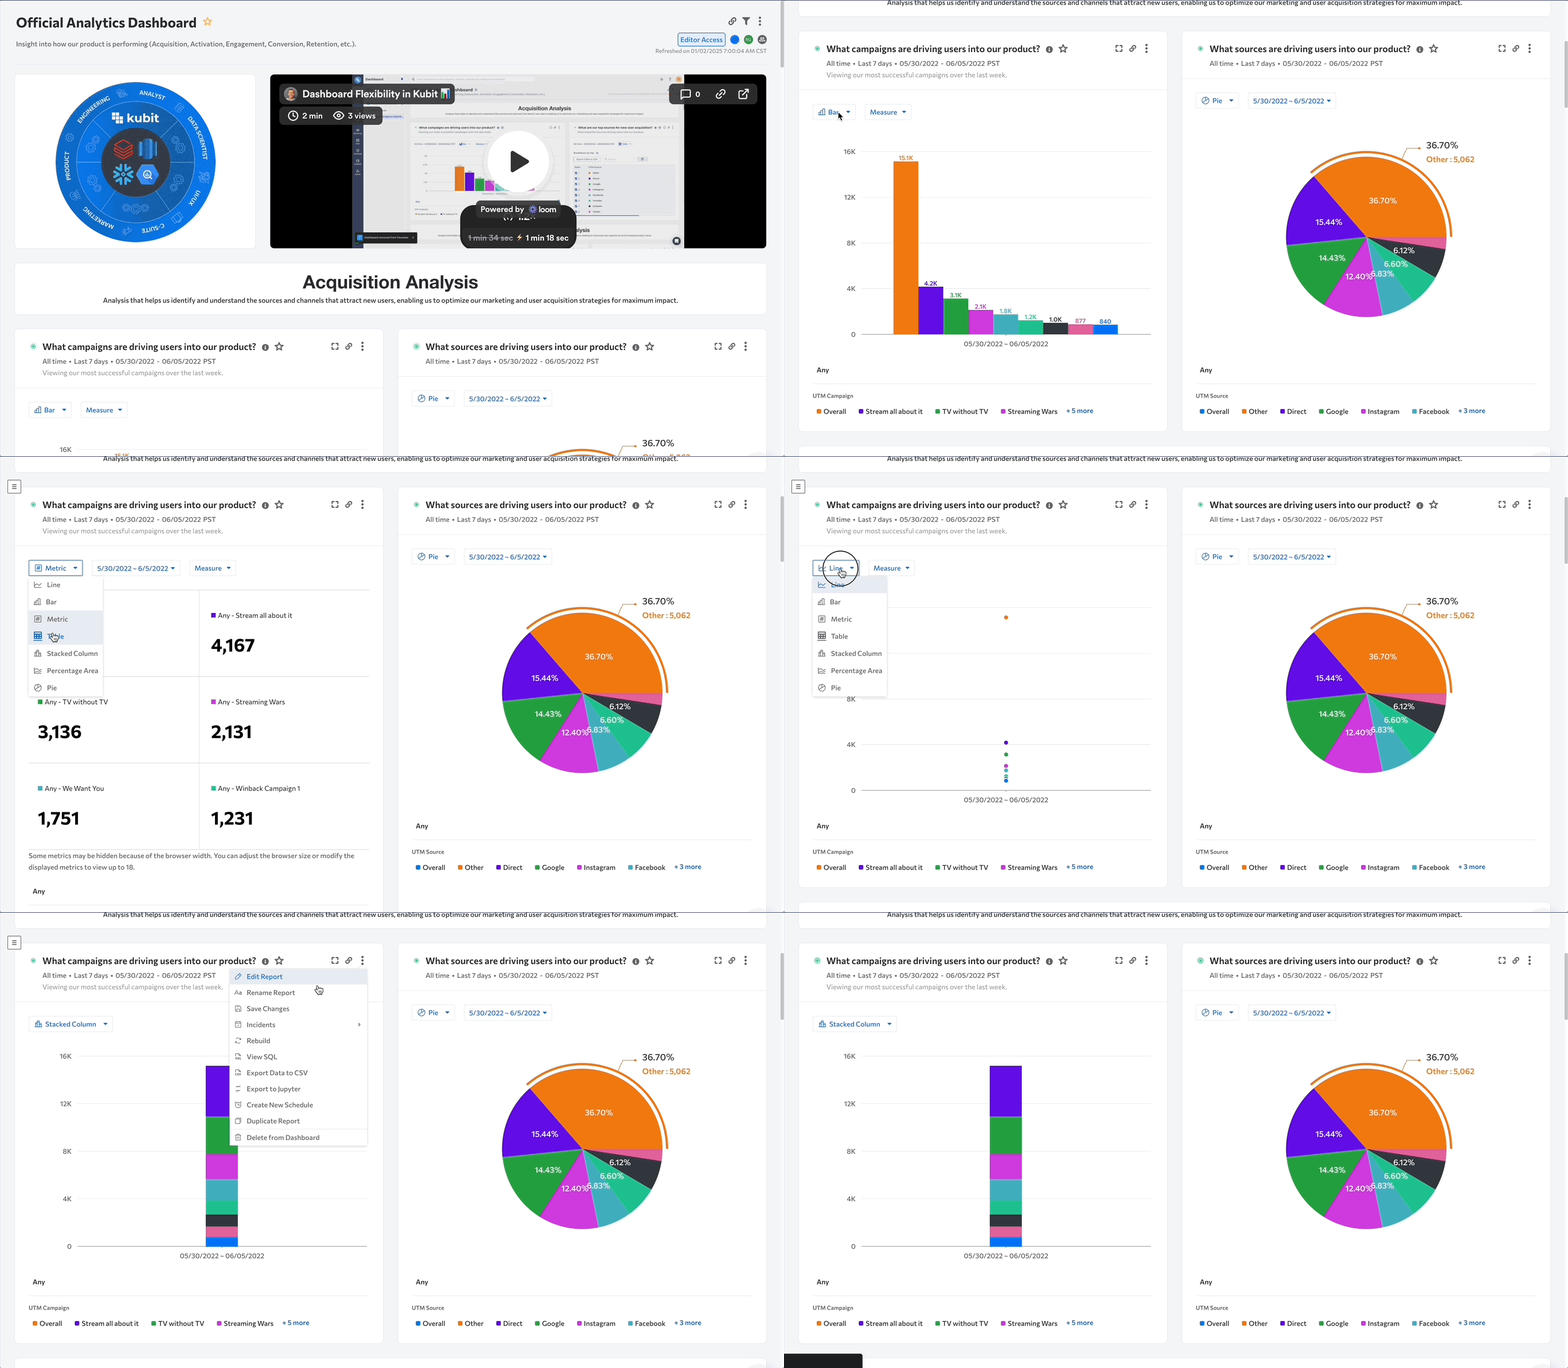
If you'd prefer to see a result as a different visualization type i.e. Line, Bar, Metric, Pie etc, you can make those changes within the report itself or on your Dashboard.
Simply use the dropdown in the upper left corner of your report to change its visualization type. Please note that some reports may only have 1 visualization and it cannot be changed.
Save Chart Settings using the vertical 3-dot menu in the right-hand corner of the report.
Below is a list of all the changes you can make directly on a dashboard:
- Chart Type
- Y-axis settings
- Measure Display
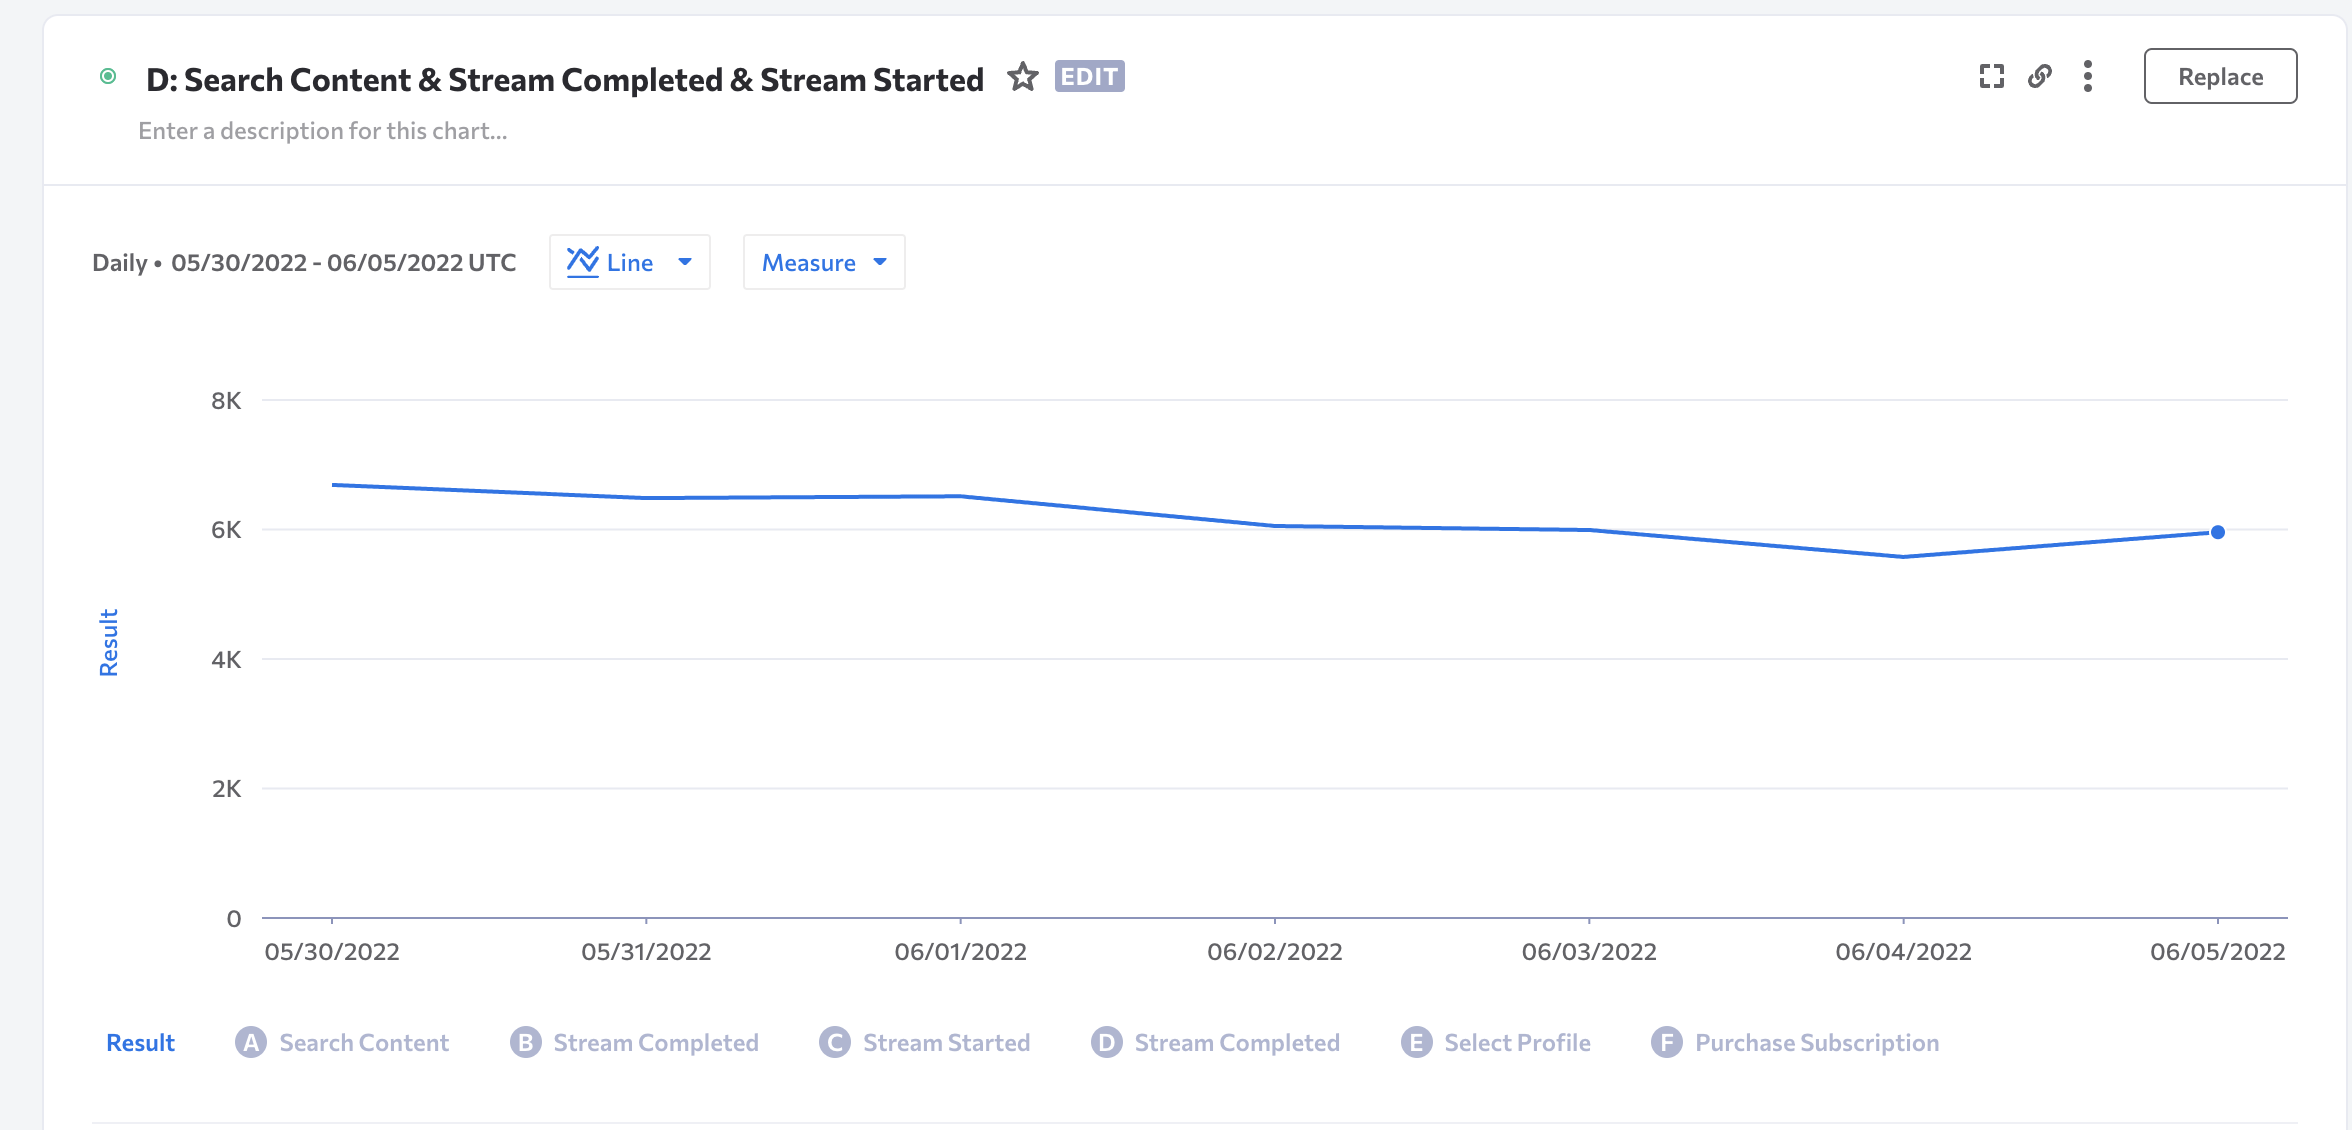
Edit & Replace a Chart on the Dashboard
If you need to change the underlying logic of a report or make more substantial changes you're able to click into the Report header (name) and we will take you directly into the builder. If you have Edit Permissions on the dashboard you will be able to make whatever changes you need. This includes:
- Modify the visualization, measures displayed, breakdowns displayed, or colors of any items
- Re-execute the entire report with new logic
- Rename any items on the report
Then, you will make your changes in the Report Editor and re-execute. From there, you'll be able to click the "Replace" button to update the Report on the Dashboard.
When clicking through to a Report from a Dashboard, a breadcrumb trail will appear above the Report results. This allows you to easily navigate back to the Dashboard they came from after reviewing the Report or making edits.

Dashboard Settings & Options
Each dashboard has controls and settings that impact all charts added to it. Some of these features may be restricted due to Dashboard Permissions.
Learn more about our Dashboard Permissions here .
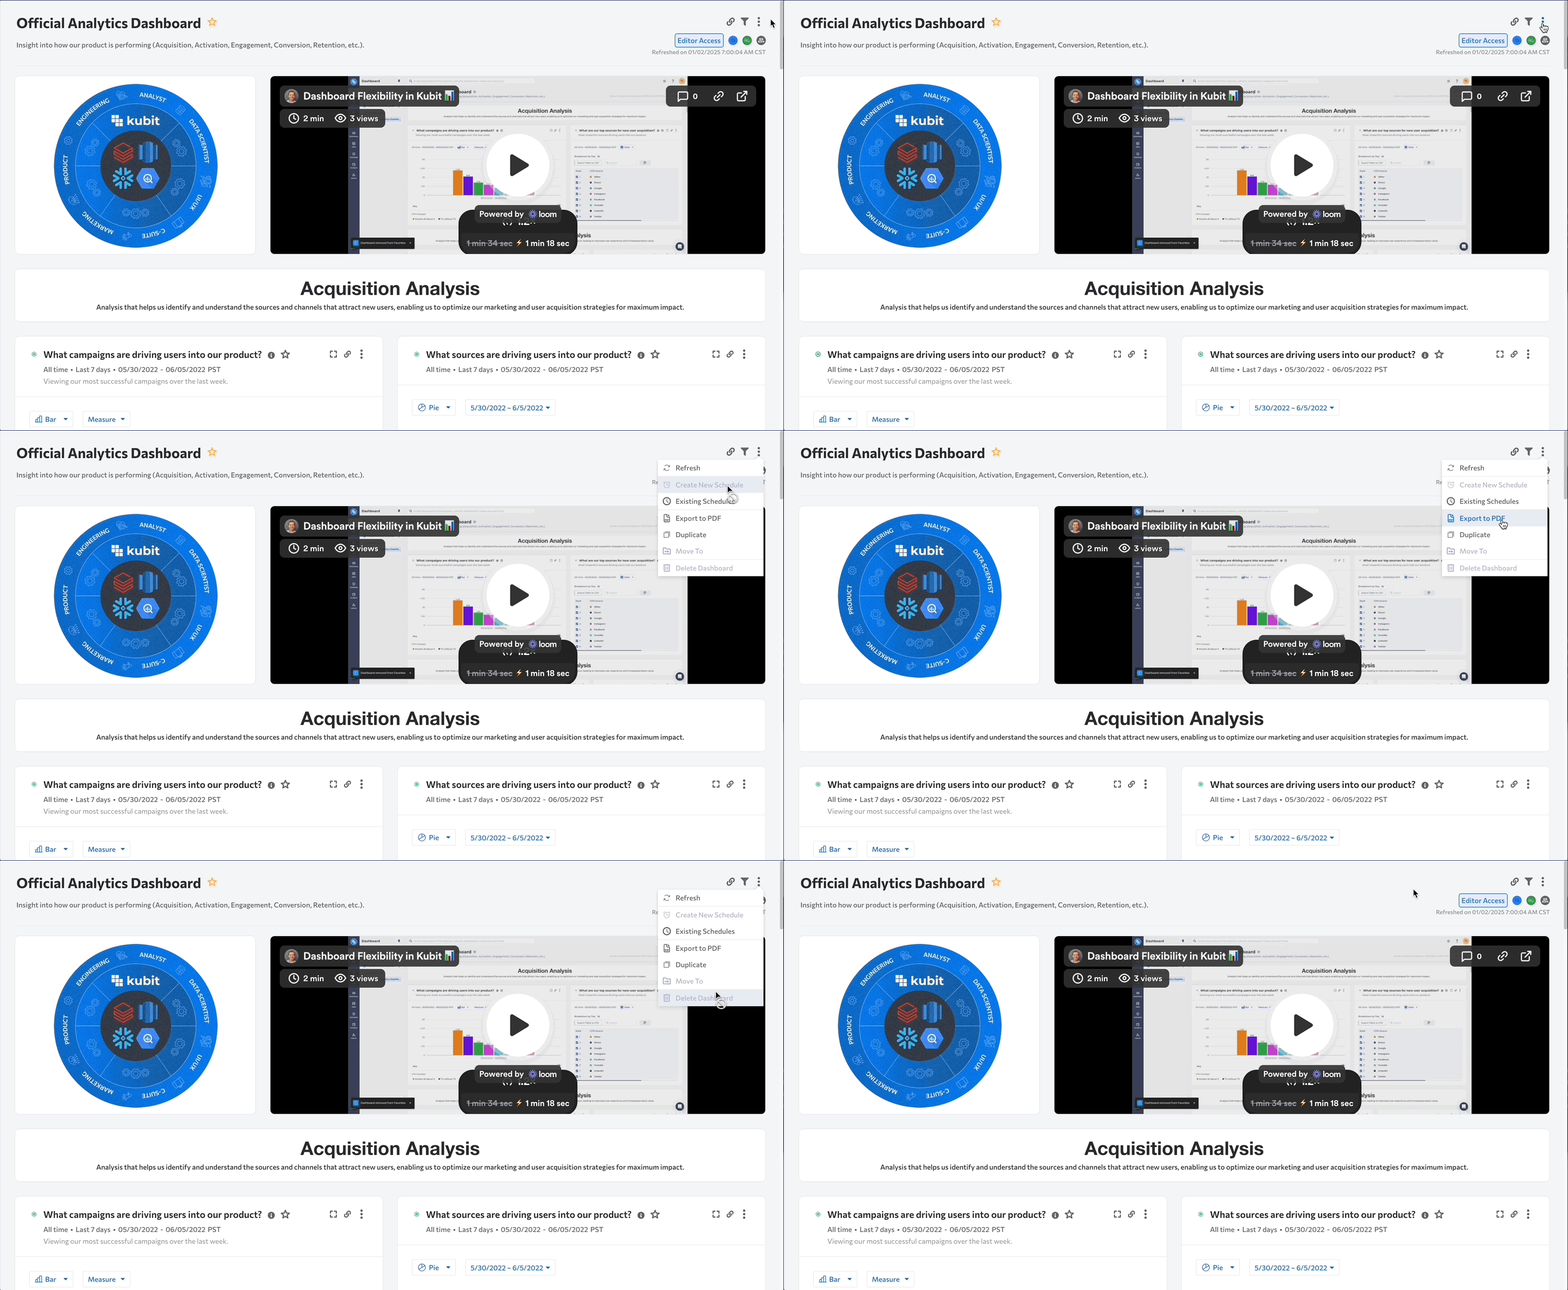
Refresh
Clicking Refresh will bring all analyses on the Dashboard up to the Live date of your Kubit data.
It will refresh back to the Nth day from the Live date depending on the date range selected.
So if you have data going back 30 days the Refresh will refresh up to the Live date and 30 days backwards.
Create New Schedule
- Creating a schedule means the dashboard will refresh itself at a predetermined schedule, so you don't need to hit the Refresh button.
- You'll receive an email about the new dashboard and any anomalies detected if you have the Alerts feature turned on.
- Input additional recipients of the email if you'd like others to be informed as well.
- Learn more about creating Dashboard Schedules by reading this article.
Existing Schedules
This will take you to the list of all existing Dashboard schedules.
Export to PDF
Download a PDF file containing all charts in the dashboard
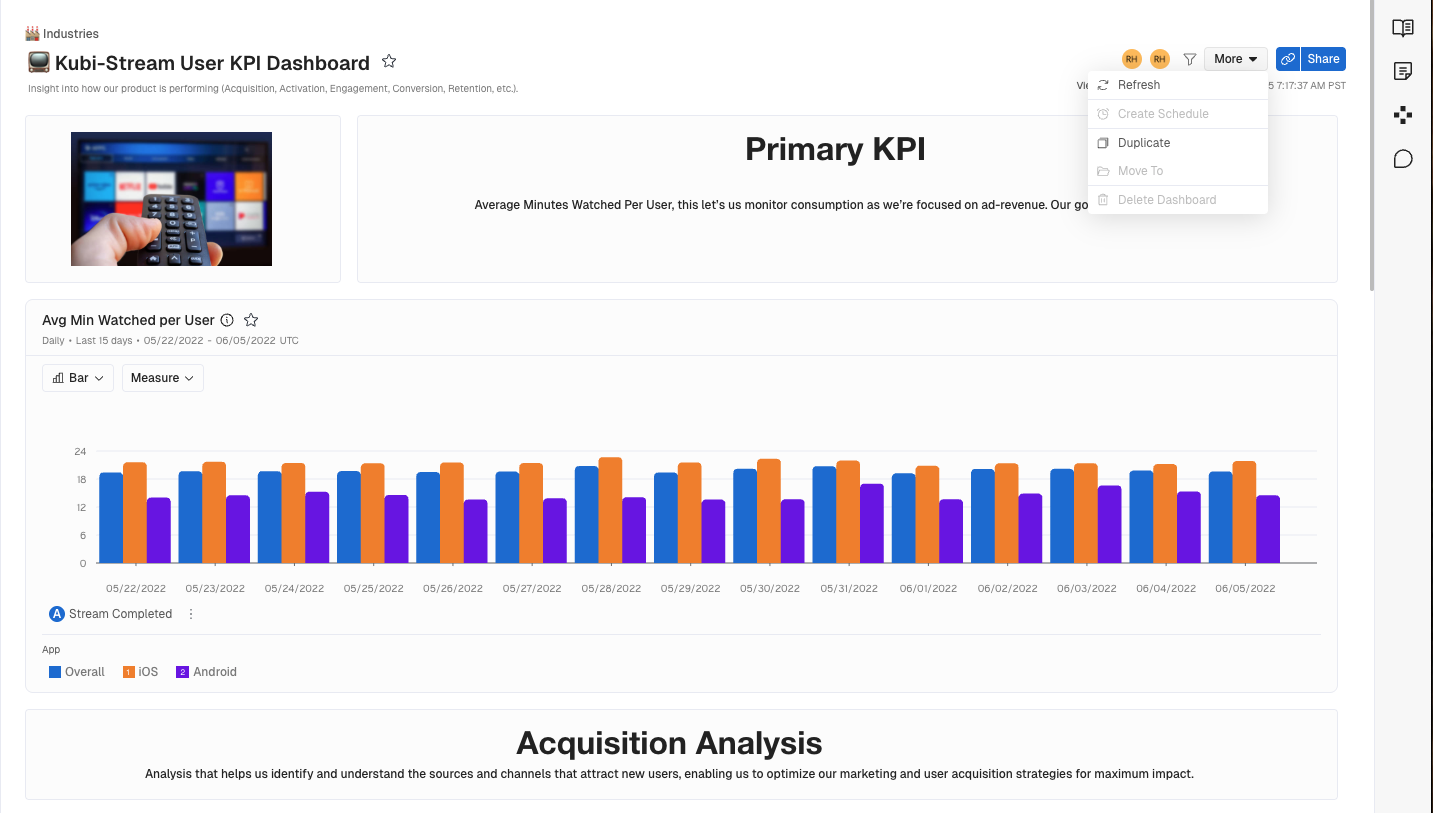
Duplicate Dashboard
- Clicking this will let you clone the current dashboard into a new one.
- This is especially useful when you've created Dashboard Filters that others are encouraged to use as a starting point.
- Simply Clone the Template dashboard and make edits to the newly created one as all charts are now unique to the new dashboard and will not impact the Template.
- If you have Dashboard Filters applied and you Clone this Dashboard it will be cloned with those filters applied to all reports on the dashboard.
Move / Publish To
- You can move the dashboard to another dashboard group.
Delete Dashboard
- This will remove the Dashboard forever, be sure it's what you want to do.
- Dashboards can only be deleted by the dashboard owner.
- The underlying charts will NOT be deleted.
Dashboard visibilityDashboards in Kubit are visible to everyone.
Sharing a Dashboard link
If you then want to share this filtered view of the Dashboard you can either copy the URL directly from your browser or click on the link icon next to the Share button in the top right corner:
Updated 3 months ago