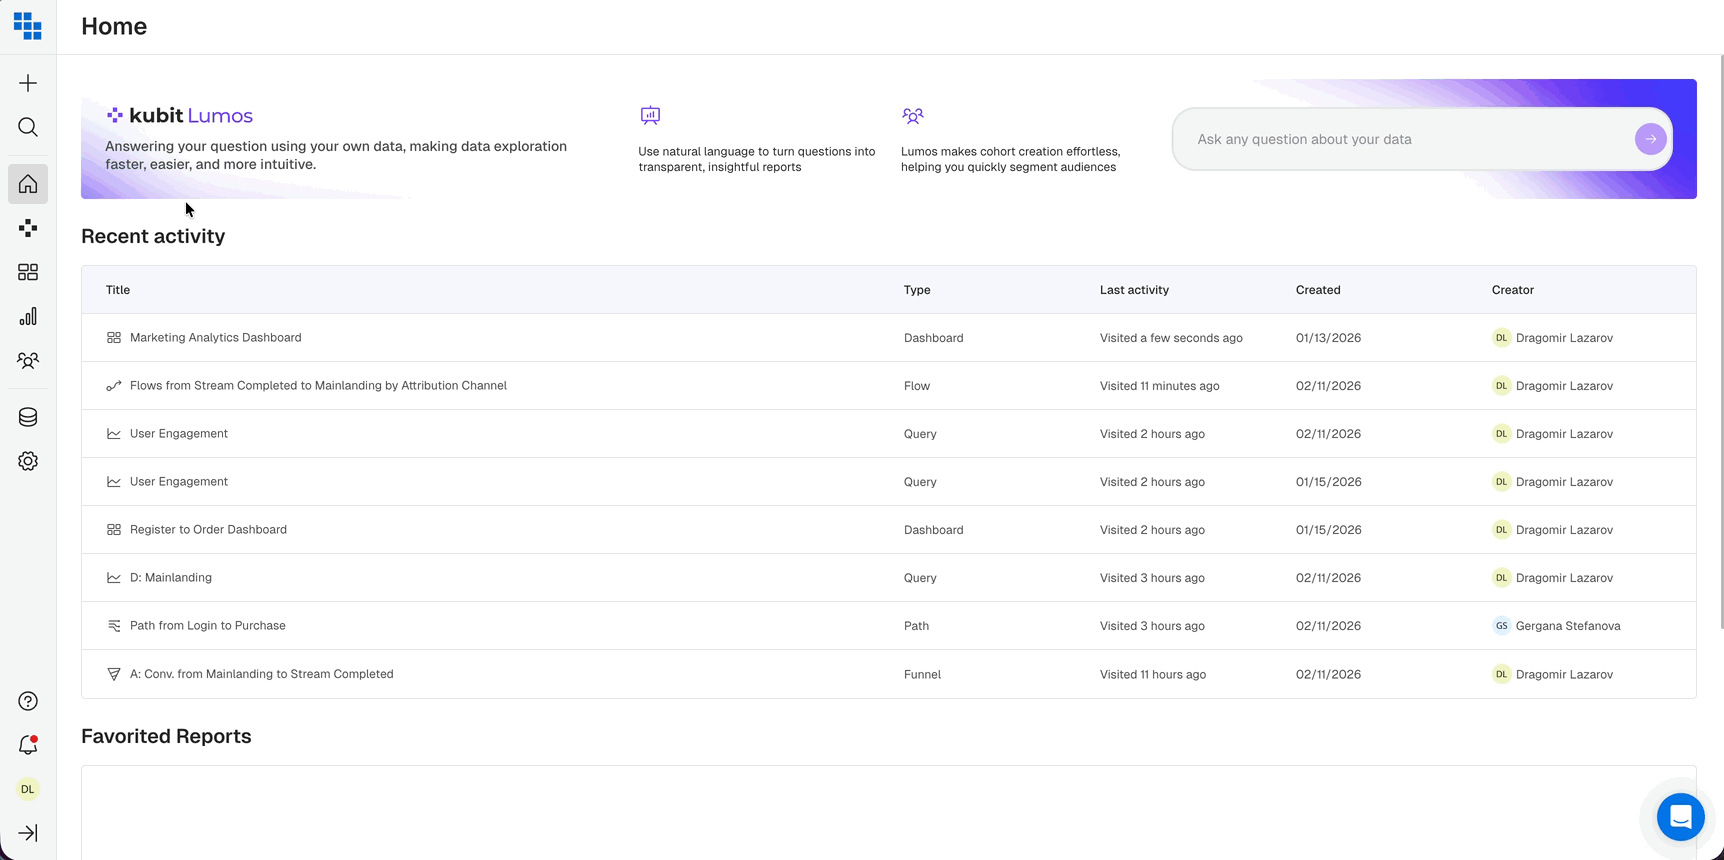
Main Navigation Items Overview
Navigate Kubit's platform structure—access dashboards, create reports, manage cohorts, search content, and configure data models through the left-side navigation menu.
The Main items can be found on the Left Side Navigation
The left navigation provides quick access to all core analytics features—from building reports and dashboards to managing data models and user cohorts.
Dashboards
Create and manage multiple dashboards to visualize your analyses. Each chart is interactive, allowing you to control refresh schedules and email notifications.
- All users can view dashboards and subscribe to received them on a schedule.
- Organize dashboards into logical groups using Dashboard Groups.
Reports
You have the ability to create several reports within Kubit and you can find them all here. Each report is designed to answer specific product analytics questions to learn more about your users.
- Query - Ask questions like "How many users did an event?" or "What percentage of users who are paying do this event?"
- Funnel - Ask questions like "What is my conversion rate for users who login to purchase?" or "Where are my users dropping off in my 4 step signup flow?"
- Flow- Ask questions like "What are the most common paths for users who go from starting a session to watching a video?" or "What are the differences in paths between my Android and iOS users?"
- Retention - Ask questions like "What % of new users return after their first 7 days?" or "How does my churn look between registered and non-registered users?"
Cohorts
Cohorts are incredibly powerful as they allow you to segment users based on previous behaviors for deeper analysis. Manage all saved Cohorts you've created or build new ones within this space.
Universal Search
Universal Search is a tool within Kubit that allows you to search all content that has been created on the platform. Situated at the top of the left navigation the Universal Search feature allows you to search by Content Types, when something was Last Updated, the Schema, Report Types, the content Creator, and Tags.

Data Management
All data related items can be found in the cog and database icon on the bottom of the left navigation.
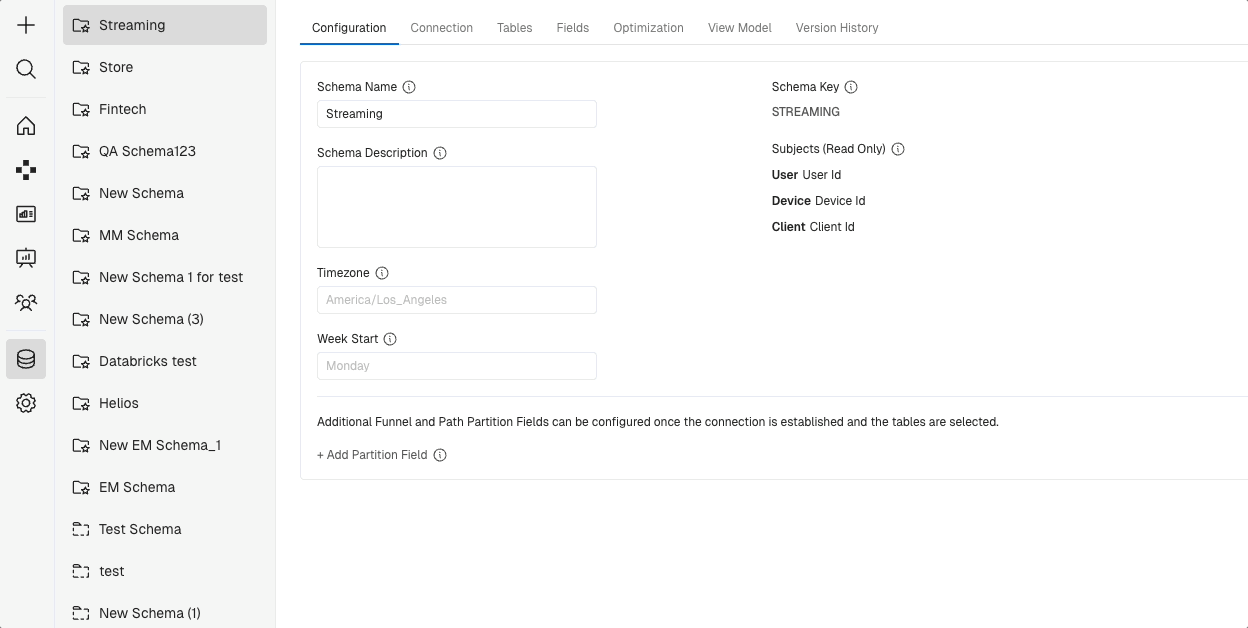
Data Modeler
Design and manage your team's data models in Kubit. Access to the Data Modeler feature is exclusively available to Direct Connect customers. Customers utilizing Data Share and Managed Service have read-only access and are unable to modify or create data models within the platform.
Kubit Admin access is required for Data Modeler.
Dictionary
Find all Events and Fields available in Kubit separated by each Data Schema. You're also able to see any saved items your team has created like Virtual Events, Filters, Measures, and Cohorts.
Schedules
A schedule is a repeated job that will execute the analysis or dashboard and send it in email. You can create a schedule from the Context Menu of a chart or a dashboard.
Incidents
Incident markers can be displayed on any chart to show the relationship between certain Marketing, Operations or Release Events and Metrics. There are many kinds of incidents and you can control their visibilities on every chart.
Updated 5 months ago