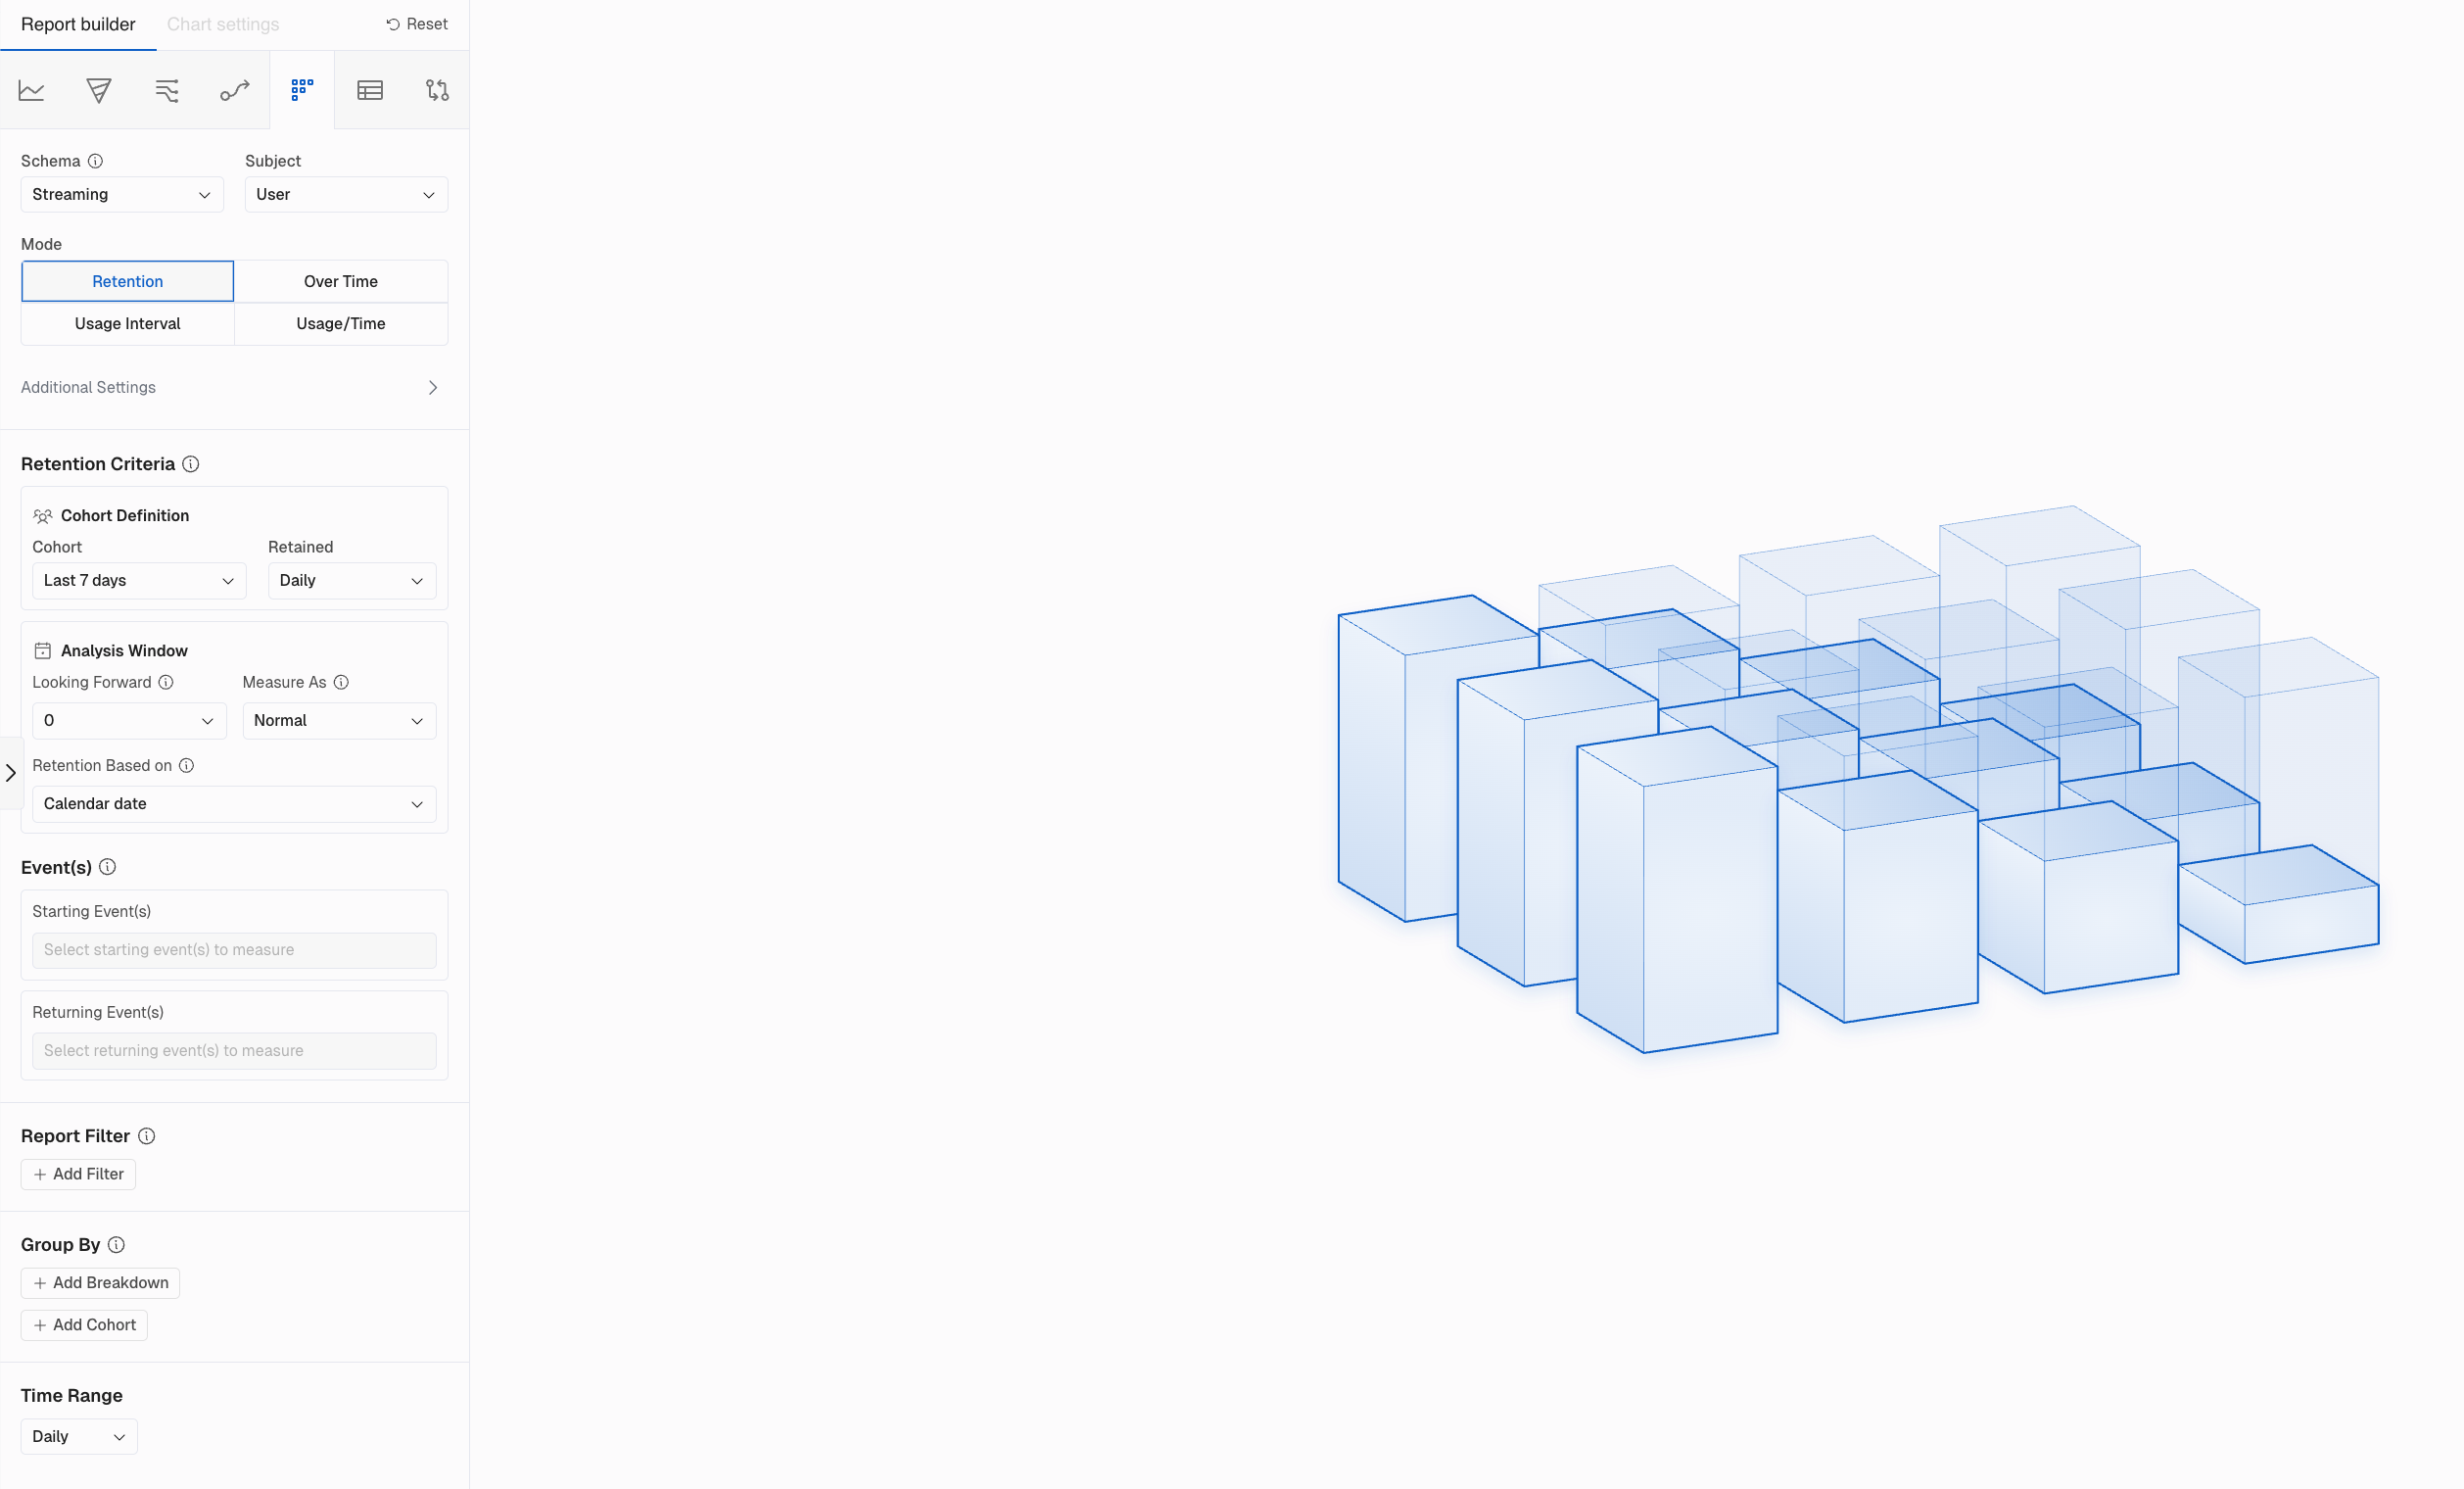
Retention
Use our Retention report to understand how frequently users return to your product.
Introduction
Retention is a Report that shows how different Cohorts of users (defined by Starting Events on a Date) retain over time. This type of analysis is typically used to understand the difference between users who retain and those who don't and how to adapt user journeys in order to make products more sticky.
Watch our Retention Training Video
The main inputs are:
- Subject: The. Subject you want to measure retention of, are custom to your environment and are things like User ID, Visitor ID, etc.
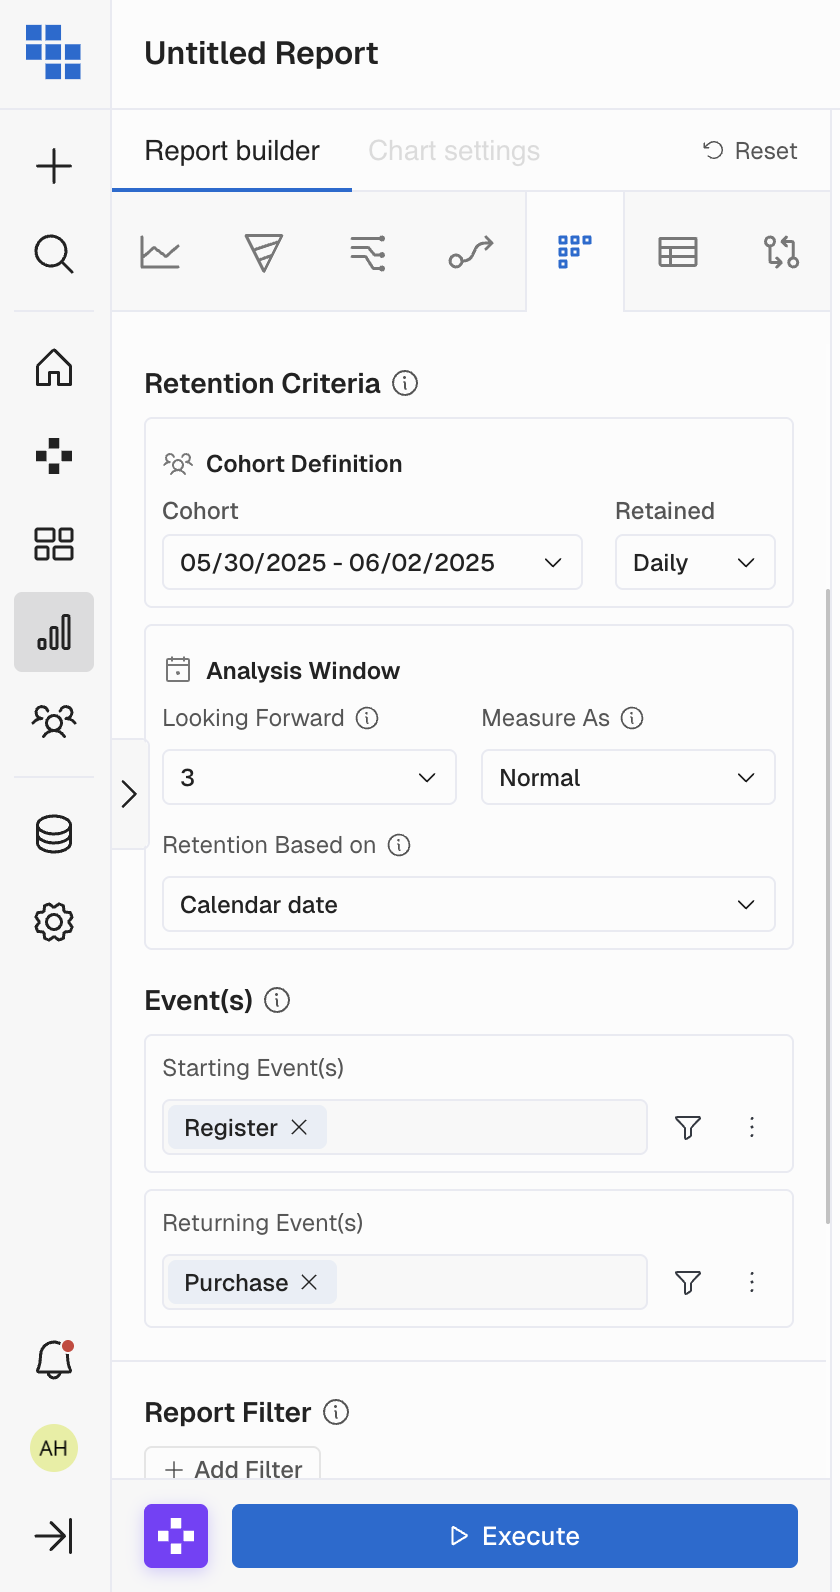
- Cohort: Specify the Date Range of the users you want to measure Retention of. The Cohort date range will select all users who performed your Starting Event within that period.
- Retained: The interval you want to view their Retention (Daily, Weekly, Monthly etc.). This section segments your Cohort into those buckets of time.
- Looking Forward: The number of days you'd like to look forward from the last date of your Cohort time period. You'll only need to update this if the last date of your Retention Cohort is in the past.
- Example: My Cohort date range is Jan 4th - Jan 6th of 2025. The current date is Jan 6th so I don't need to look forward any days because there is no data to retrieve to measure retention.
- Measure As: How you want to measure the Retention based on retention types.
- Retention Based on: If needed, change the way you want to determine a "day", should it be Calendar Day or a 24-hour period.
- Then select your "Starting Event(s)" and "Returning Event(s)".
Selecting Your Time Unit for Cohort
In Kubit you first select the Cohort of users who performed the 'Starting Event' during a specific period. The report will "bucket" these users based on the first day they did the starting event within the window of time you've selected as well as the interval of time.
Intervals of time determine how your data will be represented
If you select Daily/Weekly/Monthly etc. the user has to perform the Starting Event within the interval of time and the results will be separated by each day/week/month etc. within the time period.
- Example: If you select 1/1 - 1/5 Daily you will see a retention curve or row for each day.
- This also means that each curve or row of data will have its own Nth day.
- Example: If you select 1/1 - 1/5 Daily then all users who performed the Starting Event on 1/1/ will have 1/2 as their Day 1. If they performed it on 1/2 then 1/3 will be their Day 1.
All Time will group all users into a single cohort and will all have the same Day 1, the day following the last date of the cohort time period.
- Example: If you select 1/1 - 1/5 All Time all users will have their Day 1 as 1/6.
Retention types
There are multiple ways to measure retention, so in this section, we'll cover the ones supported by Kubit. However, there are some common concepts between all retention types.
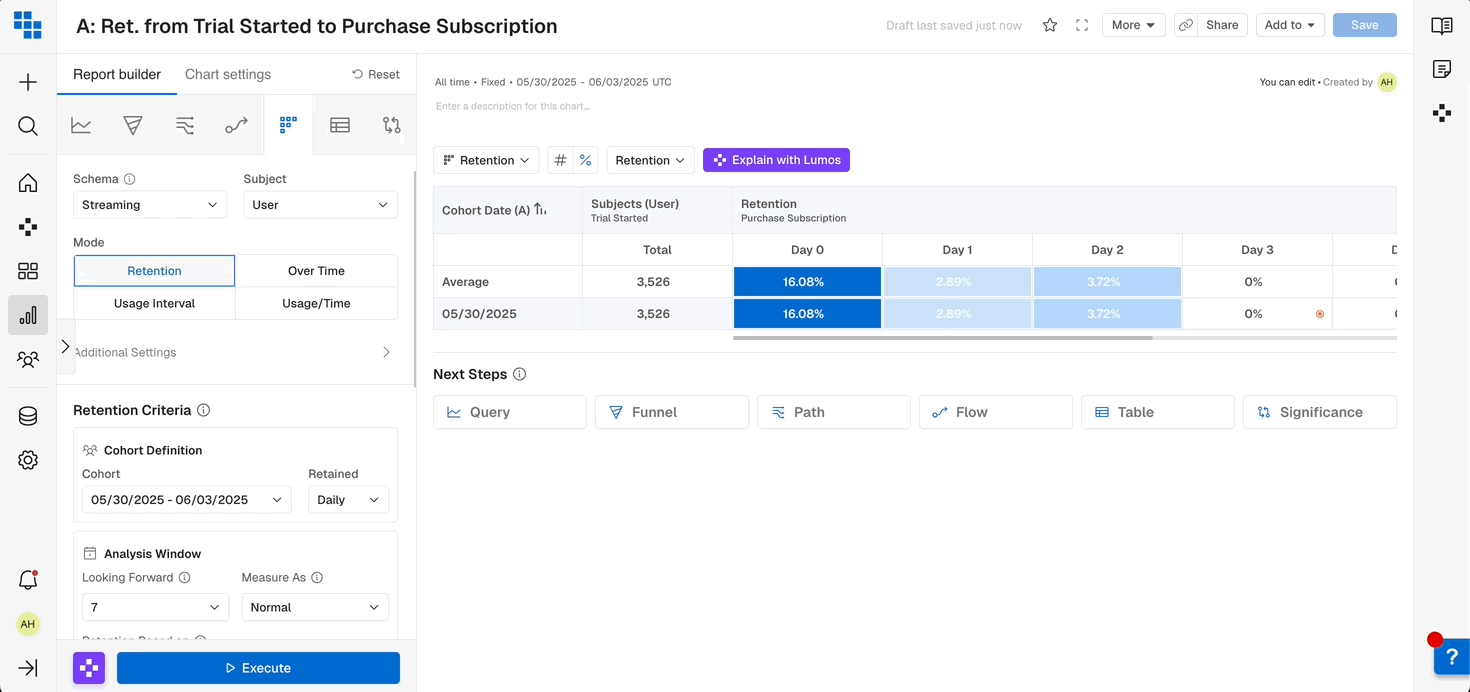
A Retention chart displays each cohort as a row identified by Cohort Date, followed by how many unique users exist on that initial date, then how many of them came back/churned on the following dates.
Normal Retention
Measuring Retention using the Normal Retention model will count all users who are part of the starting cohort and have at least one returning event on a given date.
It is useful when users are expected to return regularly over relatively short periods.
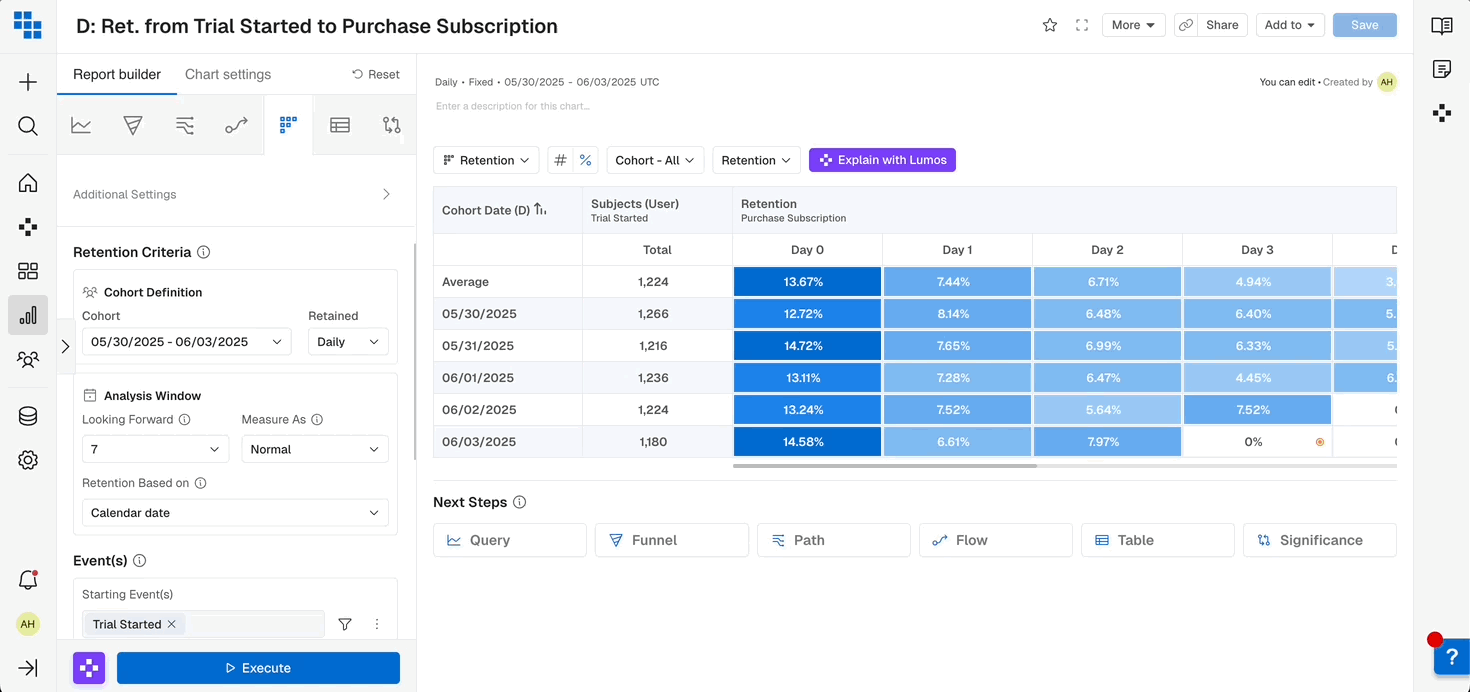
Let's use an example from an eCommerce use case and see how the Normal Retention model would work.
Say I want to measure the retention of users who Registered and then made a Purchase.
- "Register" will be my Starting Event and "Purchase" will be my Returning event.
- My Cohort will be from May 30 - Jun 2 and I want to look at my Retention Daily.
Here is how I'd build this Retention Report:
And my results will look like this:
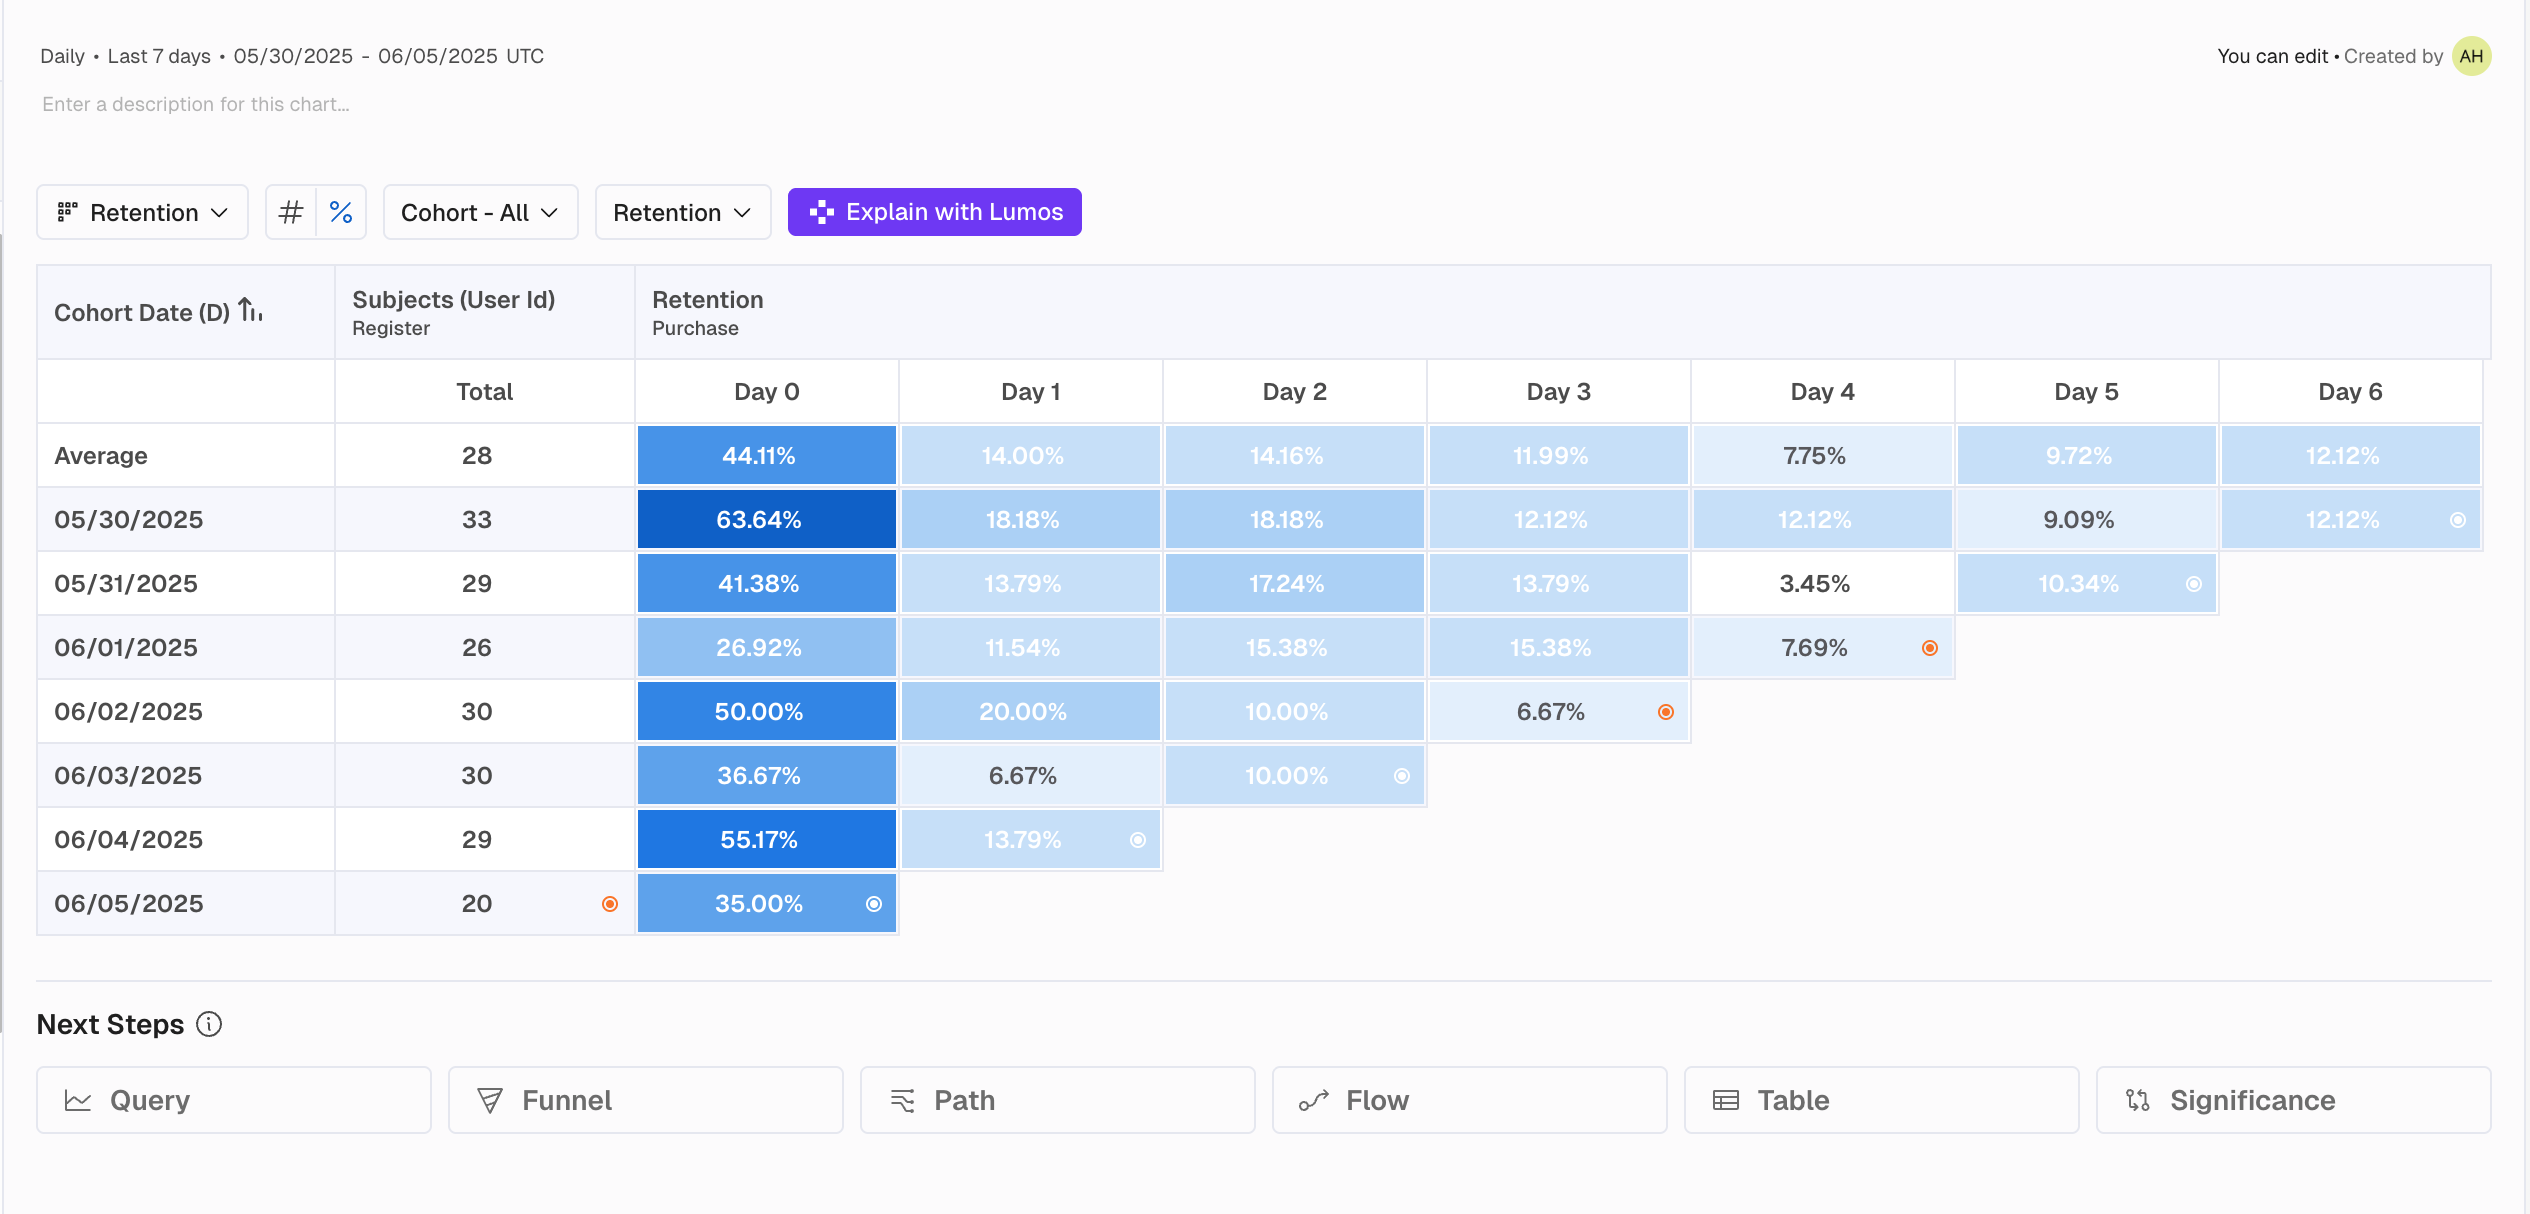
What do we see in Normal Retention results?
- Each day in my date range has its own row and we are looking at this retention Daily. Meaning how many users from the Starting Event, "Register", came back to perform "Purchase" on that specific day.
- As an example, of the 33 users who Registered on 5/30/2022, 63.64% of them returned the same day (Day 0) to make a Purchase. 18.18% returned the next day (Day 1) to make a Purchase.
How does Normal Retention impact your insights?
- In Normal Retention we only count a user as retained on the specific day they performed the Return event.
- If a user makes a Purchase on Days 0, 1, 3, and 5 they will only be counted in the numerator for those days.
Unbounded Retention
In some businesses, users return less regularly, e.g. once a month to pay a bill or fill in supplies. When that's the case Unbounded Retention can help get a more accurate number of retained users because users will be counted on their return date and on all dates before it.
This means a user doesn't have to perform the return event on a specific day, instead perform the return event on or after a given day.
Let's use an example from an eCommerce use case and see how the Unbounded Retention model would work.
Say I want to measure the retention of users who Registered and then made a Purchase within their first 7 days.
- "Register" will be my Starting Event and "Purchase" will be my Returning event.
- My Cohort will be from May 30 - Jun 5 and I want to look at my Retention Daily.
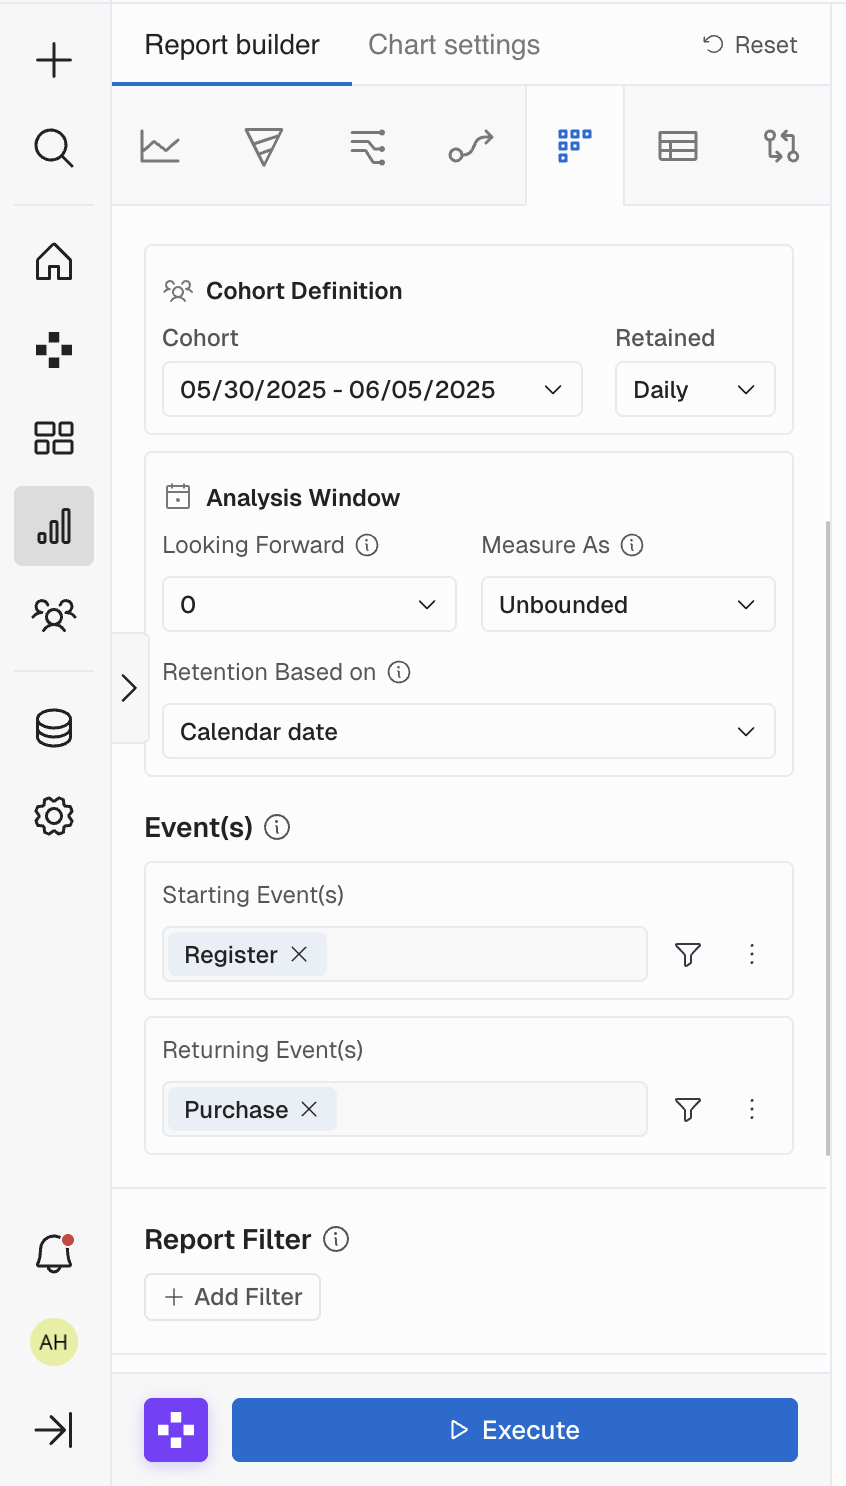
Here is how I'd build this Retention Report:
And my results will look like this:
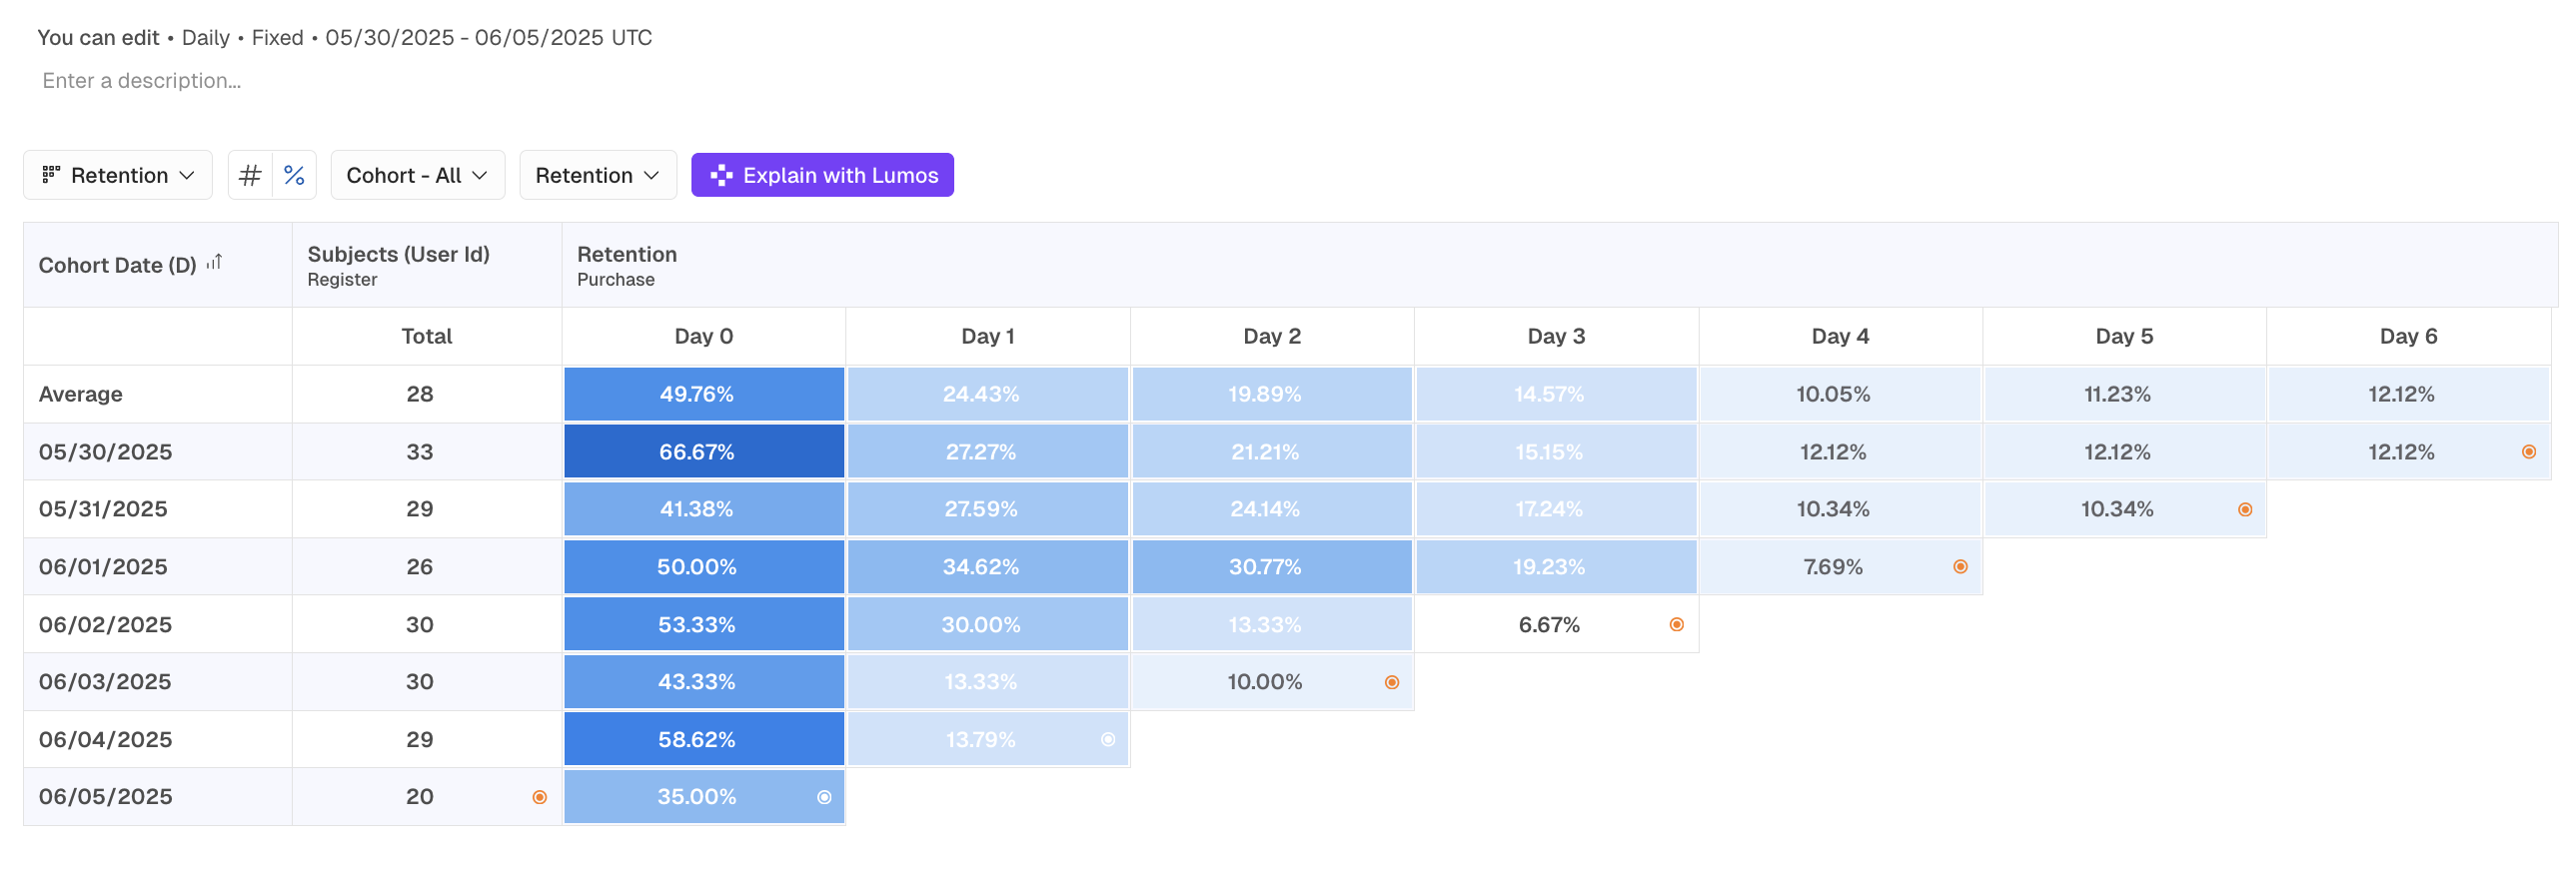
What do we see in Unbounded Retention results?
- Each day in my date range has its own row and we are looking at this retention Daily. This means how many users from the Starting Event, "Register", came back to perform "Purchase" on a given day or any day after.
- As an example, of the 33 users who Registered on 5/30/2022, 66.67% of them returned the same day (Day 0) or any day after to make a Purchase. 27.27% returned the next day (Day 1) or any day after to make a Purchase.
How does Unbounded Retention impact your insights?
- In Unbounded Retention we count a user as retained on a day if they performed the Return event on that day or any day after that date.
- If a user makes a Purchase on Days 0, 1, 3, and 5 they will be counted on every day from Day 0 to Day 5.
- Even though they didn't Purchase on Days 2 and 4 they are still counted as retained because they returned on the following days.
- You typically see a much smoother retention curve as you're counting users up to the last date they perform your Return event.
Rolling Retention
Rolling retention is called Rolling, because we only count a user as retained if they perform the Return event every day/week/month etc. in your Retention report. Think of it as a "binge" activity or highly engaged users. It's most useful when high stickiness is expected in your product or business model.
Let's use an example from an eCommerce use case and see how the Rolling Retention model would work.
Say I want to measure the retention of users who Registered and then made a Purchase every day within their first 7 days.
- "Register" will be my Starting Event and "Purchase" will be my Returning event.
- My Cohort will be from May 30 - Jun 5 and I want to look at my Retention Daily.
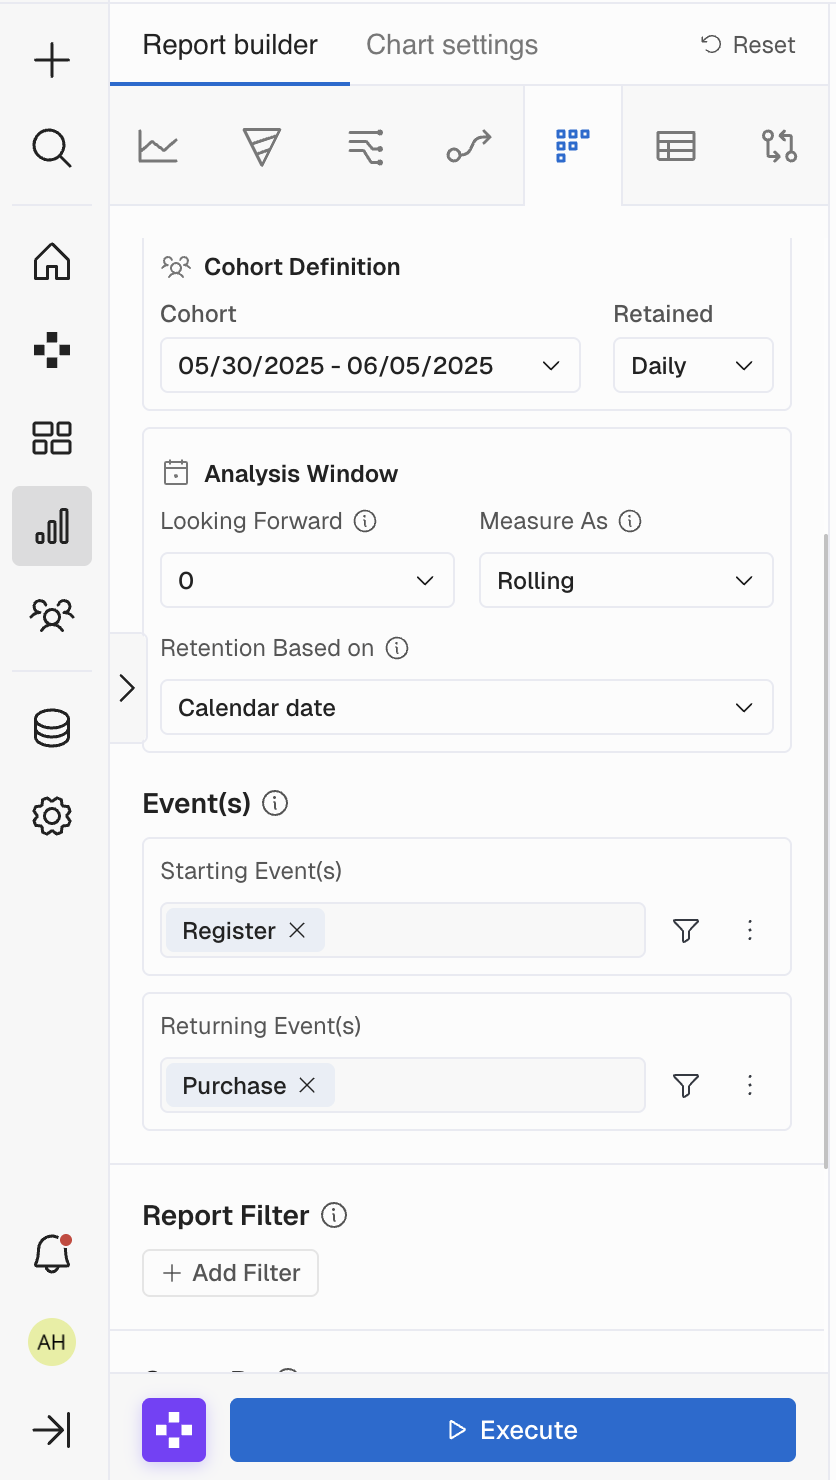
Here is how I'd build this Retention Report:
And my results will look like this:
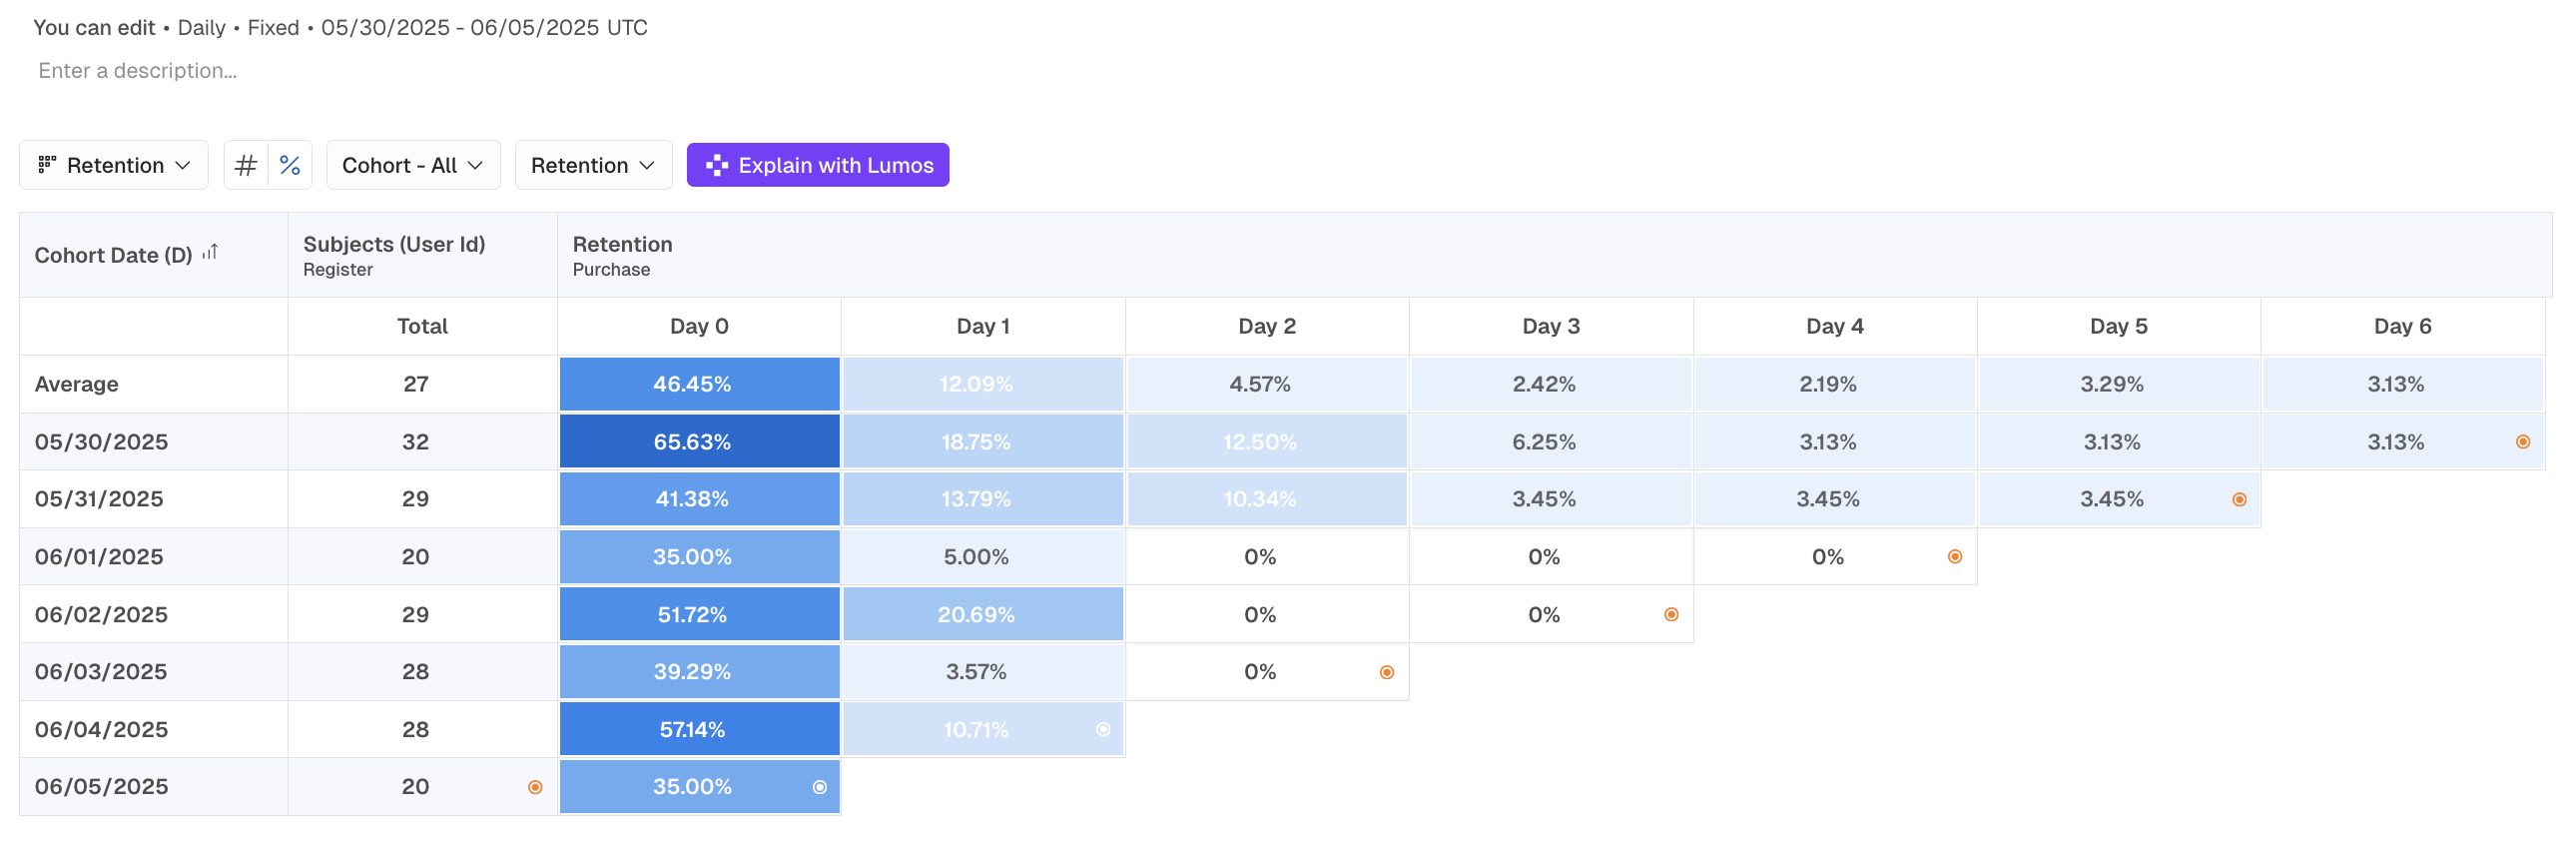
What do we see in Rolling Retention results?
- Each day in my date range has its own row and we are looking at retention Daily. This means how many users from the Starting Event, "Register", came back to perform "Purchase" every day of their return period.
- As an example, of the 32 users who Registered on 5/30/2022, 65.63% of them returned the same day (Day 0) to make a Purchase. 18.75% returned the next day (Day 1) to make a Purchase.
- The users who made a Purchase on Day 0 but did not return on Day 1 are ignored on subsequent days of your retention results.
How does Rolling Retention impact your results?
- In Rolling Retention, we count a user as retained on a day if they performed the Return event on that day and the day prior.
- If a user makes a Purchase on Days 0, 1, 3, and 5 they will only be counted up to Day 1 as they did not return on Day 2.
- You typically see a steeper retention curve as you're counting users who returned every interval of time, which is often not a majority of users.
Retention Modes
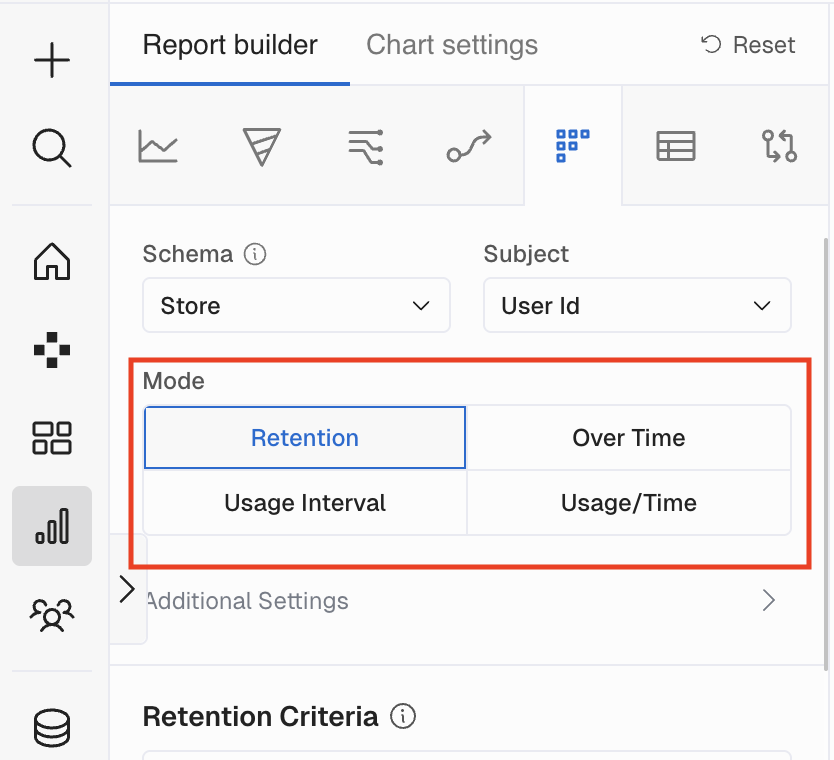
Retention
Retention shows how different Cohorts of users (defined by Starting Events on a Date) retain over time. This is the most common and default mode of measuring Retention Rates.
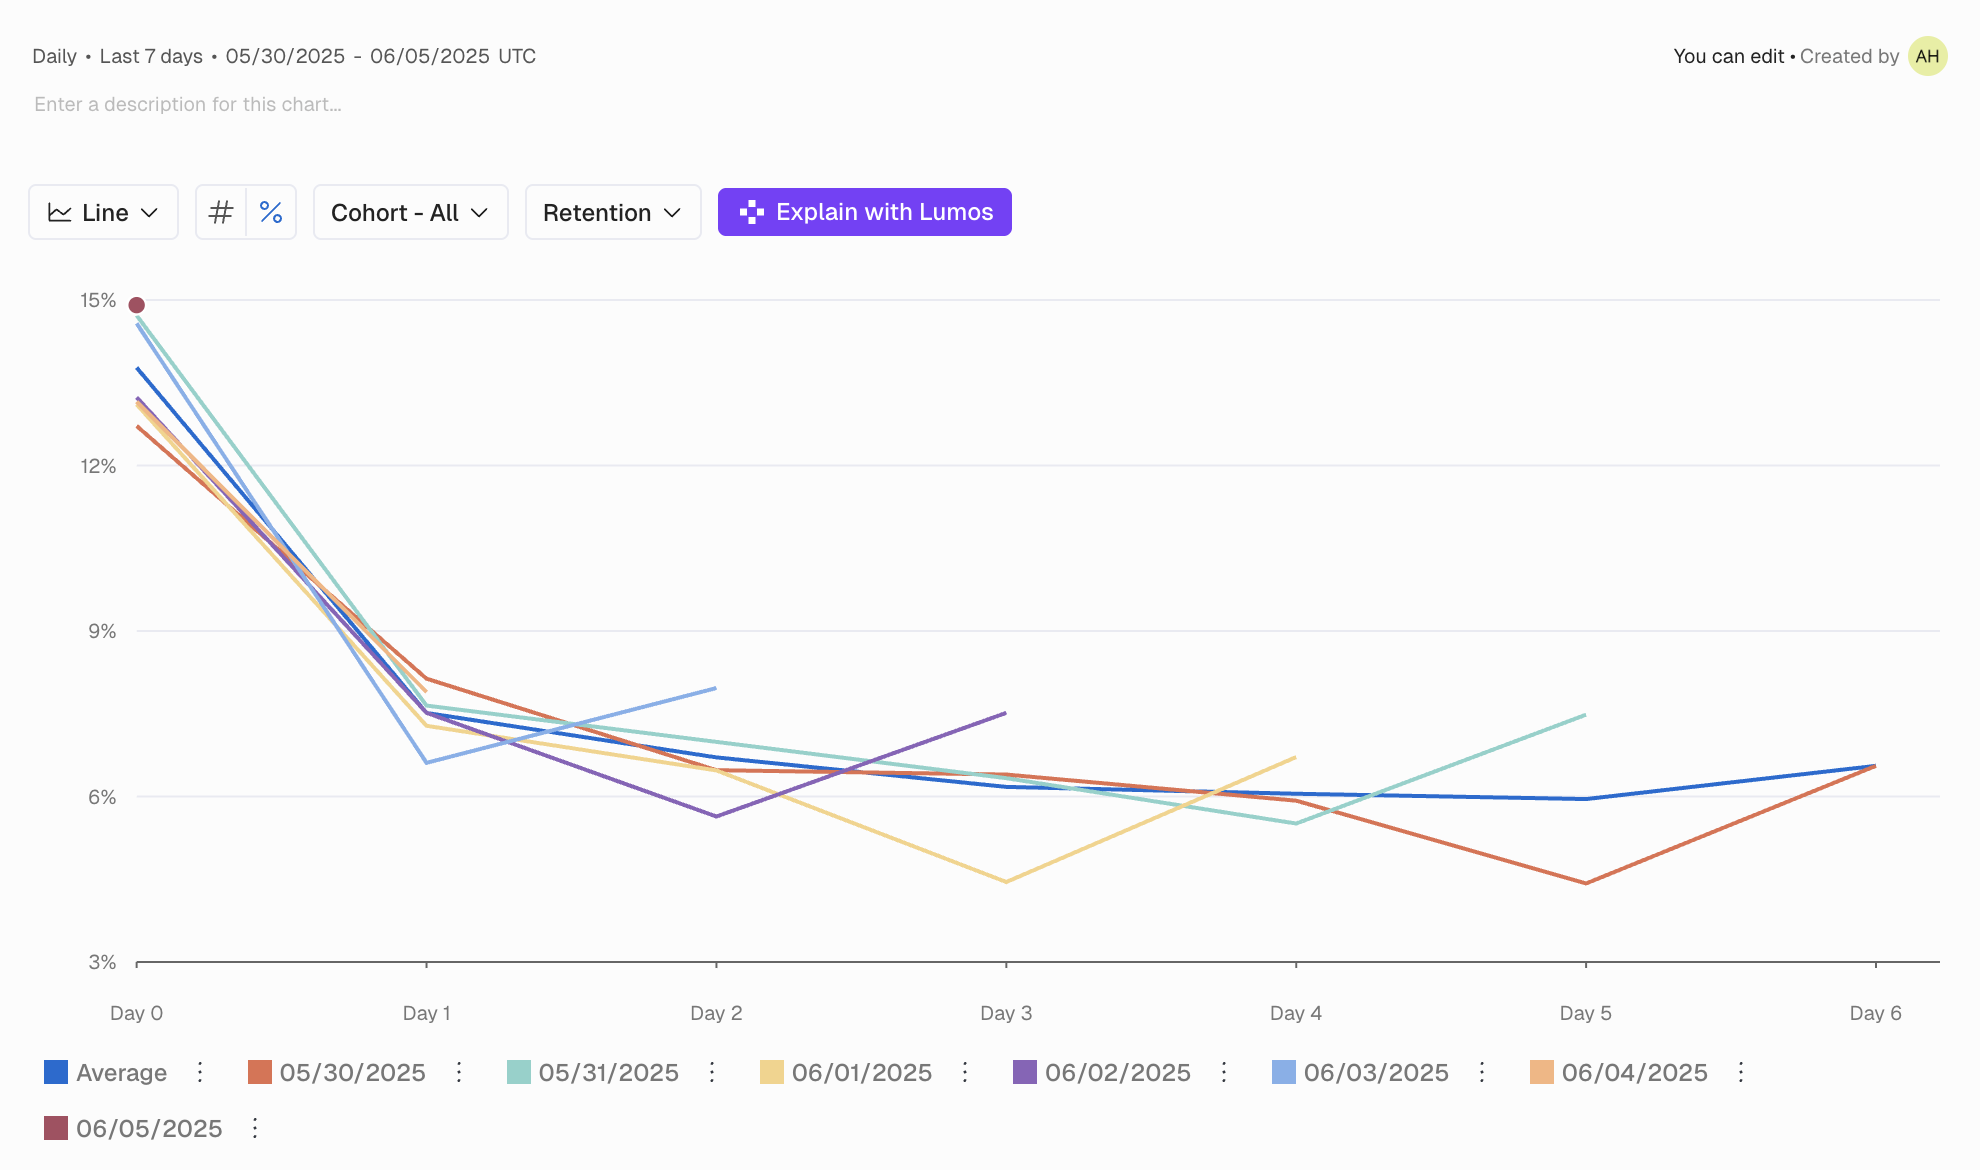
Retention Over Time
Retention over time plots the trending retention rate for users retained on each interval of time i.e. Day 1, 3, 7. This is great to understand if your Day 1 retention rate is improving over each cohort of subjects.
You'll notice with this mode the lines plotted are the Daily Retention points vs. the cohort dates like in the default Retention mode.
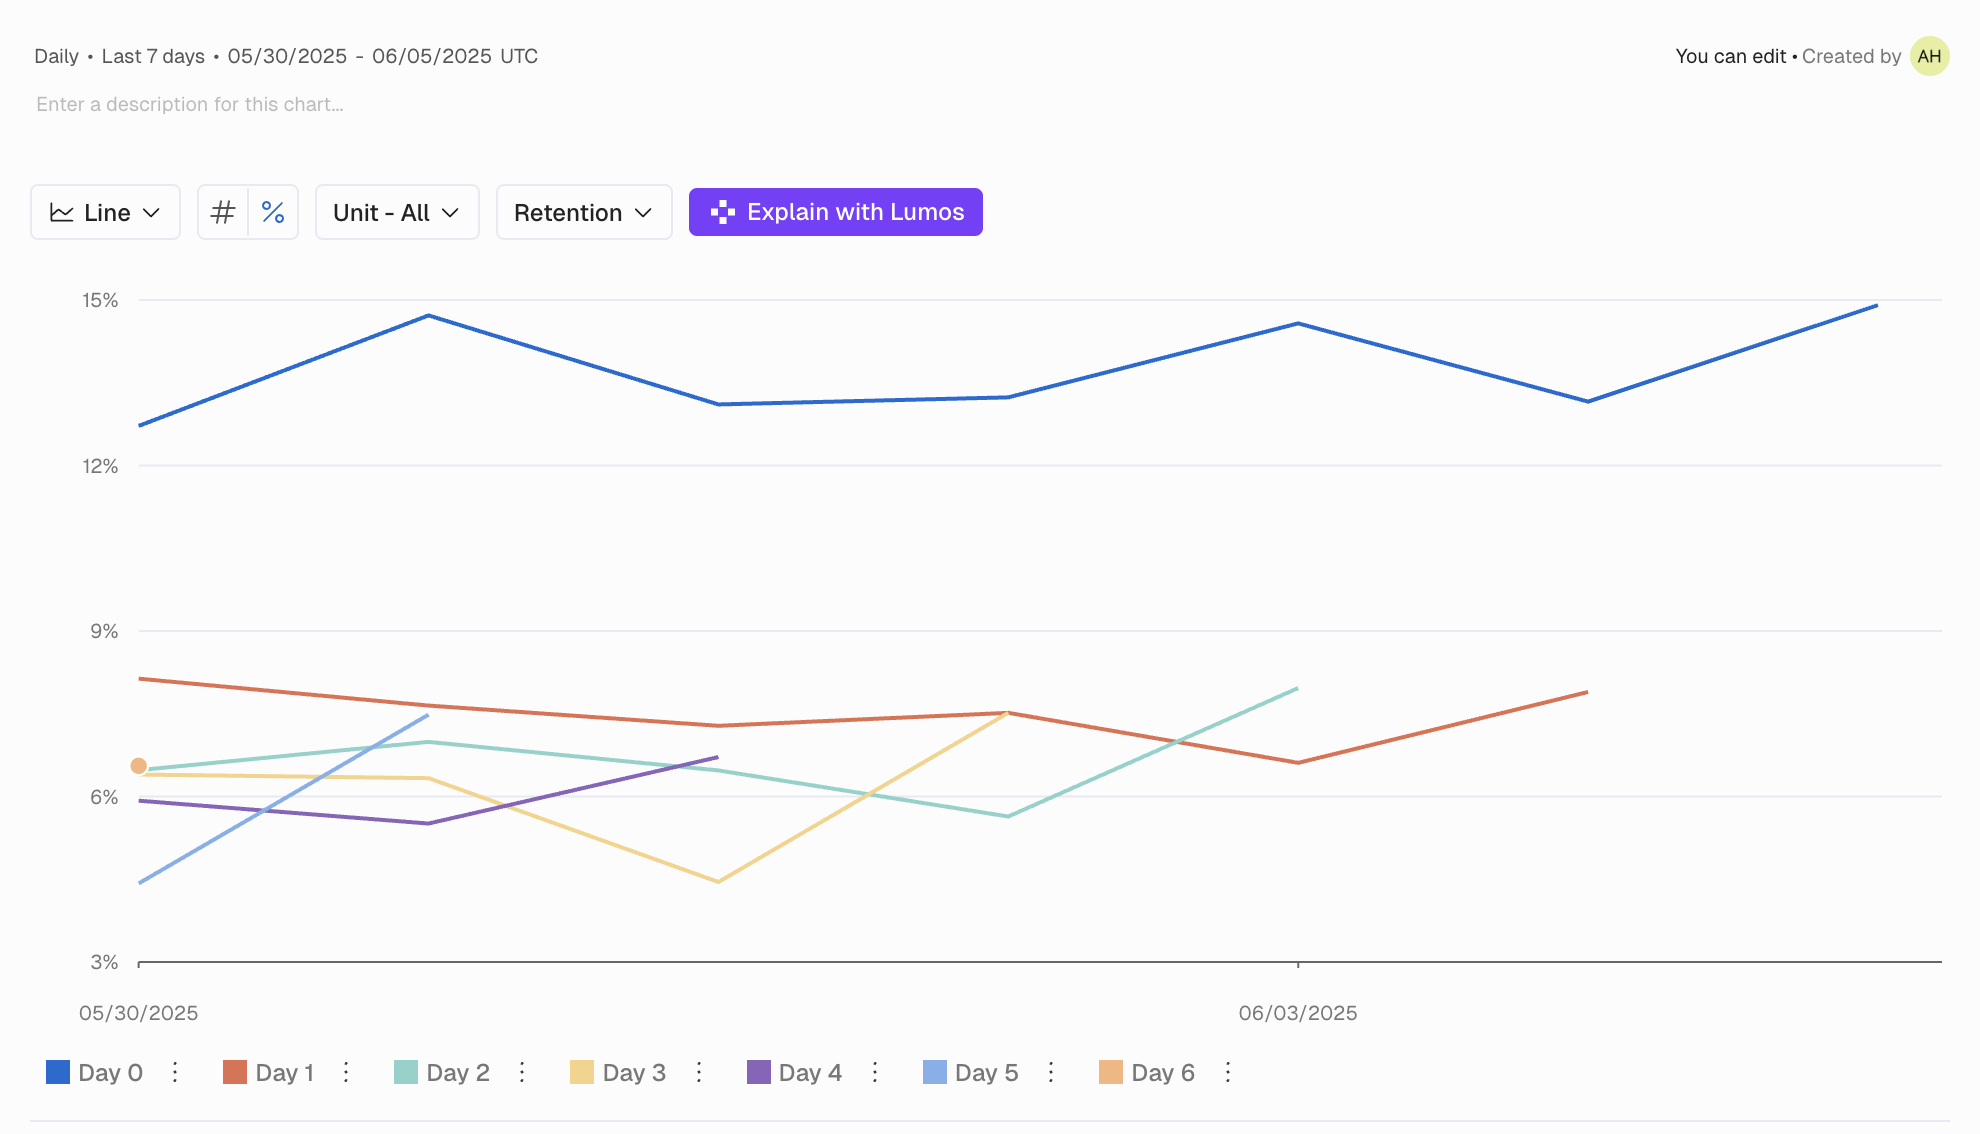
Usage Interval
Usage Interval shows the typical Usage Interval of a product feature, e.g. what % of users have generated the returning event by Day X. Typically you'll use Usage Interval to understand what a good Retention timeframe would be.
To identify this you must look for when the line crosses a 50% threshold. That's when half of your Users typically perform the returning event.
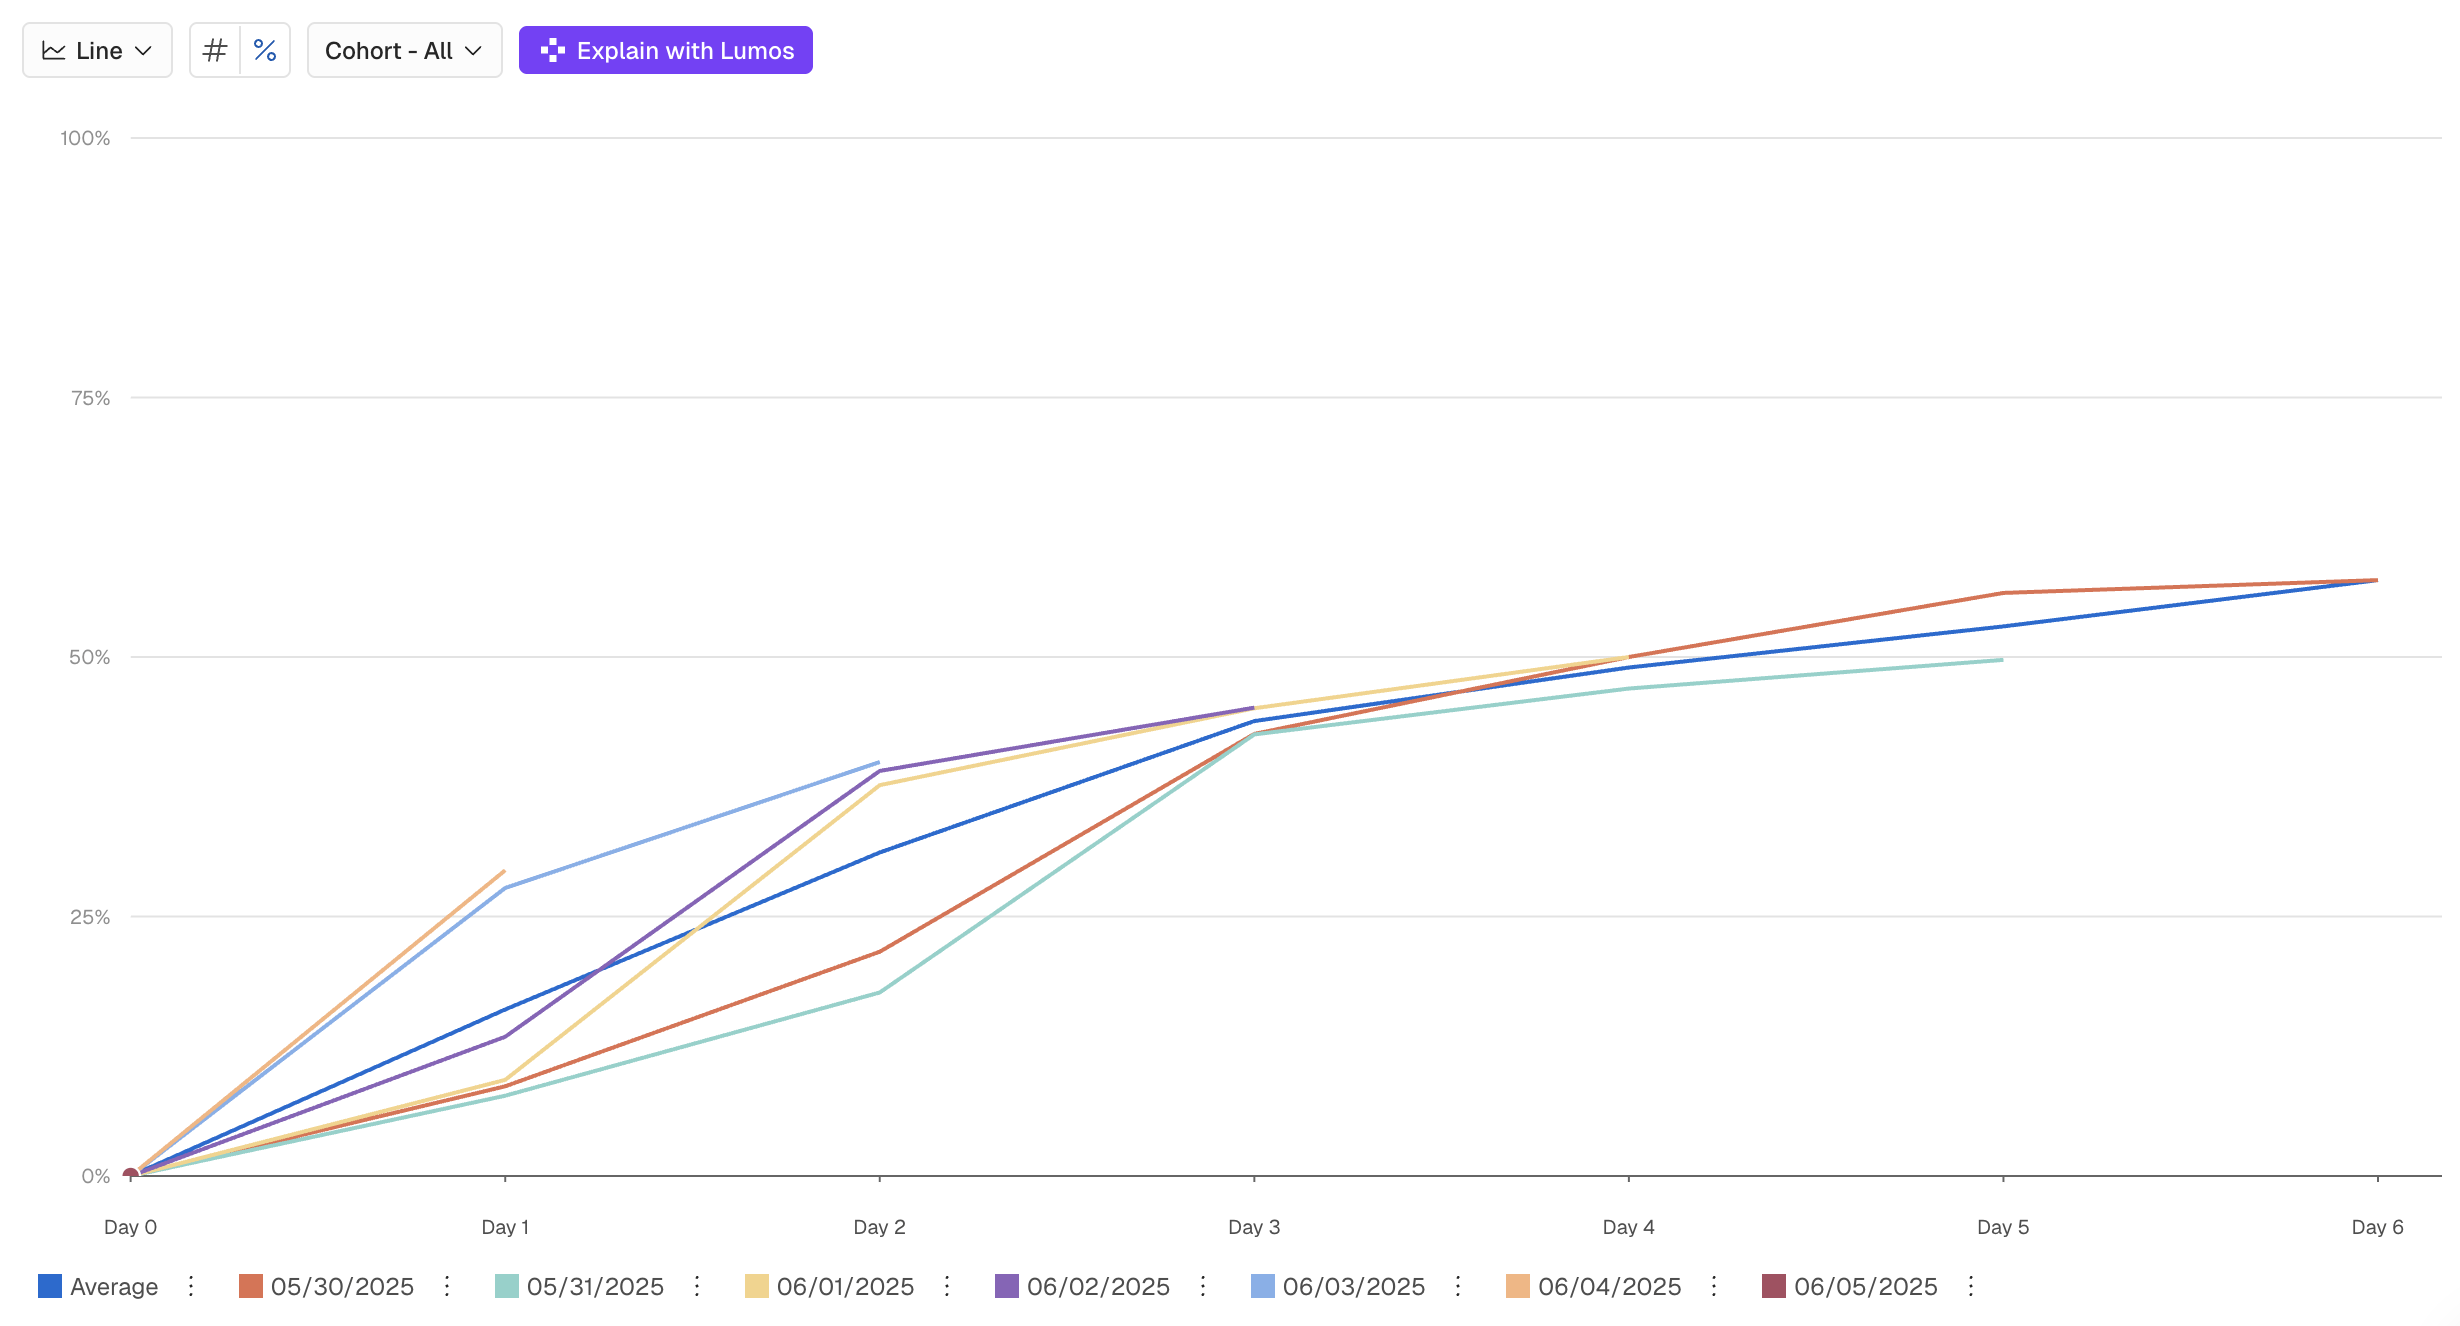
In the above example, 50% of users return on Day 4 to perform the return event which means our Retention report should use 4-day intervals to be consistent with user behavior.
Usage Interval Over Time
Usage Interval Over Time shows you how the Usage Interval of an event changes over time. Similar to Retention Over Time you can see if the interval of time Usage Interval of each cohort is higher/lower over time.
Measure Churn
Churn is essentially the inverse metric of Retention. If Retention tells us how many users are returning, Churn measures how many users are not coming back. Switching from Retention to Churn is done by a switch and does not require re-execution of existing analyses.
Retention Calculation Windows
In retention there are typically 2 ways to think of a day:
-
A Calendar Day that starts at 00:00 and ends at 23:59.
-
A 24-hour Window between the "Starting" and "Returning Event(s)" that is individual for each user.
Let's assume the following sequence of events for a user:
-
Start event - 2025-07-01 10:00:00
-
Return event - 2025-07-01 11:00:00
-
Return event - 2025-07-02 09:00:00
-
Return event - 2025-07-02 12:00:00
Strict Calendar Date
A strict calendar date window computes the difference between start and return events based on calendar dates. Let's go through the example above.
| Start Event | Return Event | Retained at Day |
|---|---|---|
| 2025-07-01 10 am | 2025-07-01 11 am | Day 0 |
| 2025-07-01 10 am | 2025-07-02 9 am | Day 1 |
| 2025-07-01 10 am | 2025-07-03 12 pm | Day 2 |
Strict calendar date windows are not equal because in this case, the start date makes the window shorter compared to Day 1, 2, etc. In the example above Day 0 starts at 2025-07-01 10 am and ends at 2025-07-01 at 11:59 pm while Day 2 and 3 have exactly 24 hours of length starting from 00:00:00 and ending at 11:59 pm.
24-Hour Windows
24-hour windows define each day as an equal interval of exactly 24 hours after each start event timestamps. Let's go through the example above again but this time using 24 hour windows calculation window.
| Start Event Return Event Retained at Day | ||
|---|---|---|
| 2025-07-01 10 am | 2025-07-01 11 am | Day 0 |
| 2025-07-01 10 am | 2025-07-02 9 am | Day 0 |
| 2025-07-01 10 am | 2025-07-03 12 pm | Day 2 |
The example above shows that each day is computed exactly 24 hours after the start event. Day 0 starts at 2025-07-01 10:00:00 and ends at 2025-07-02 09:59:59.
That's why the returned event at 2025-07-02 09:00:00 is computed as Day 0 but not Day 1 as it will be with a Strict Calendar Date window.
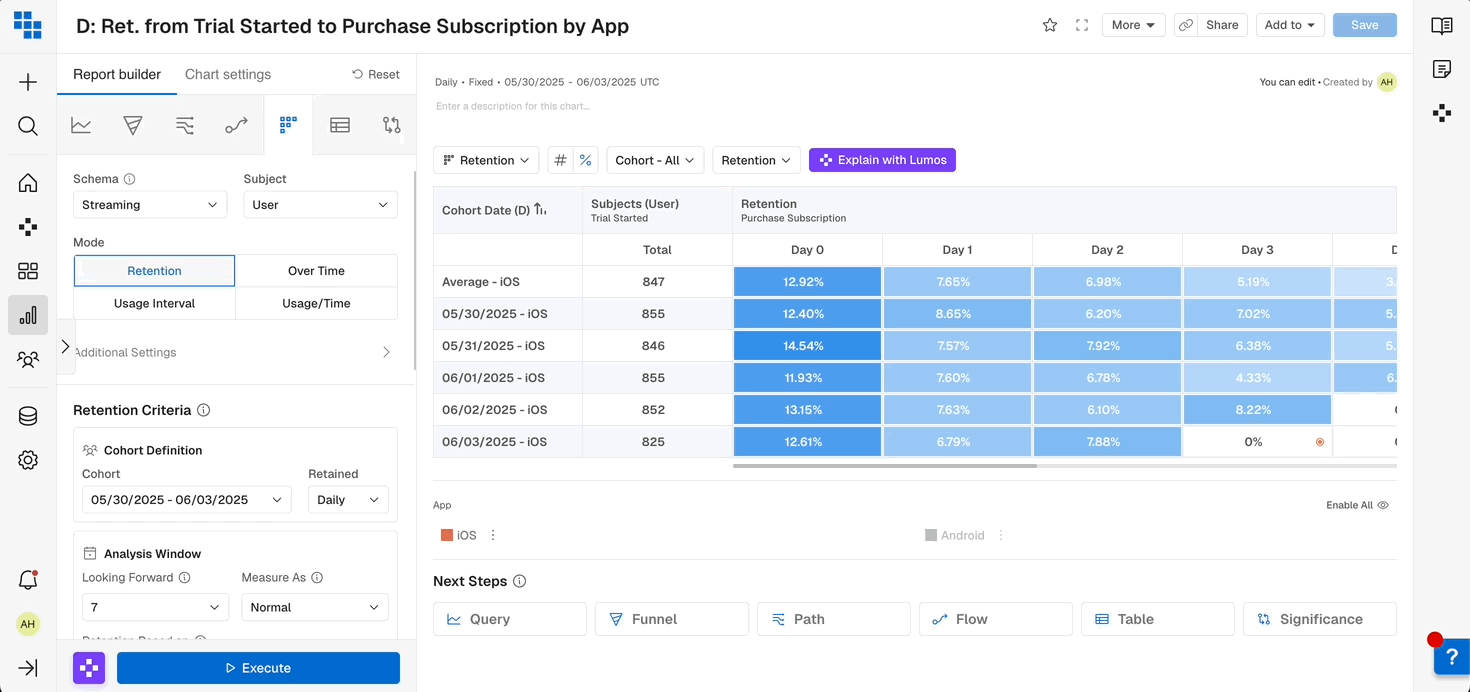
Breakdown in Retention
Whenever a Breakdown is specified in Retention you can use the 'Average' toggle to display the average count for all breakdown groups as a separate group. The 'Average' group is displayed with the other date groups.
Average toggle default with BreakdownThe toggle Average is switched on by default when Breakdown is selected.
Advanced Retention Features
There are a few advanced parameters which can be used to fine-tune the analysis:
Attribution
- Linear means that a User will be assigned to all Cohorts when the Starting Event(s) occurs (inclusive)
- First means that a User will be assigned only to the Cohort for the day when the first Starting Event(s) occurred.
- When using First attribution and creating a Cohort from this result Kubit will enforce the "since" date to ensure we are not including the erroneous subjects in the Cohort created.
Group by
- Group by is only applicable when there is a Breakdown specified.
- For example, if there was a Breakdown per Country when Group by = "Starting", Kubit will group users only for the
Starting Event(s)and ignore theReturning Event(s)' Country code. - When Group by = "Global", both
StartingandReturning Event(s)have to have the same Country code.
Updated 6 months ago