Cohorts
Create and analyze user cohorts based on behavioral patterns, compare cohort performance, and use them as filters or segments across reports to drive targeted insights.
What is a Cohort?
A Cohort means a group of users all fitting a certain set of criteria within the same time period. One often-used cohort is the group of users who registered for a service on the same date. There can be other kinds of cohorts depending on the context. For example:
-
Paid vs organic users (based on acquisition source).
-
New (registered in the last 7 days) vs old (registered more than 7 days ago) users.
-
Frequent streamer (streams more than 5 times a week).
Cohort analysis allows companies to identify the behavioral patterns of their customers clearly and adapt and tailor their products and services for specific cohorts.
In Kubit you can:
-
Create and Sample Cohorts.
-
Compare how different Cohorts behave, convert and retain.
-
Use Cohorts as Filters in other Reports.
-
Use Cohorts as Segments in other Reports.
-
Export Cohorts to Customer Engagement Platforms such as Braze (add-on feature).
Elements of a Cohort
When building a Cohort anywhere within Kubit important inputs are needed to ensure you see the correct information.
Subject
The unique identifier that will be returned in the Cohort list. This should be relevant for the event/report you are referencing to build the cohort.
- For example, A cohort of User IDs that logged in versus a list of Visitor IDs that visited a page. It's likely User IDs aren't available until a user has logged in.
Type
Depending on the type of behavioral filters you want to segment into a Cohort will determine which type you should use.
- Performed: matches Subjects that performed certain event(s).
- For example, User IDs that performed the Logged In event.
- Measure: applicable for aggregations or counting of items.
- For example, Count Events of Logged In > 5
- Users who logged in greater than 5 times.
- For example, Count Events of Logged In > 5
- Query: Any Subjects whose Query result in the specified time window matches the conditions.
- Give me all User IDs who's result within a Query had a value of > 5.
- Funnel:
- Converted on step N: Subjects who converted on all steps including step N.
- Dropped off since step N: Subjects who converted on all steps leading up to N and didn't convert on step N.
- Dropped off before step N: Subjects who appear on step 1, then fail to convert on any step before N.
- Best when you want to understand drop off from step 1 of the funnel.
- Retention: any Subject who returned or churned in one of the following intervals:
- Overall: any time between start and end date
- On: in time bucket specified
- Month 1, Day 4 etc.
- Since: in time bucket specified or later
- Month 1 or later, Day 4 or later etc.
Time Windows for Cohorts
Each option will apply additional logic for your Cohort based on when the Subject satisfies the criteria you've selected.
- Overall: This option selects all Subjects who met the criteria at least once during the report's entire timeframe or the specified cohort date range.
- Current: This option selects all Subjects who met the criteria on the same date as the Report definition event(s). As an example: A Query report measuring Count Events of "Enable Notifications" over the last 7 days with a "Started a Stream" cohort filter set to a "Current" Time Window. This setting ensures the user is only counted if they performed both actions on the same day.
The Current option does NOT take into account when the subject performed the report definition event(s).
- In each: This option selects all Subjects who performed the defined event or measure 'in each' interval of time defined in the report. This option is only available for Performed and Query cohort types. As an example: A Query report measuring Count Events of "Enable Notifications" over the last 7 days with a "Started a Stream" cohort filter set to a "In Each" Time Window.. This will require the user to have performed both Enable Notifications and Start Stream in every individual time bucket (e.g., every day or every week) of the report period.
The In Each option DOES take into account when the subject performed the report definition event(s). Both had to have been performed in each interval of time.
- Rolling backward: Subjects are selected as long as they satisfied the Cohort conditions within the X days preceding any given date in your selected range.
As an example:
- We want to set a 7-day Rolling Backward window for a "Power User" cohort for a
Single Day: October 15th. To be counted in the cohort, the system looks at the 7-day window immediately preceding it: October 9th - October 15th.
As a result: If the user performed the action on October 10, they are "In" for October 15.
- We want to set a 7-day Rolling Backward window for a "Power User" cohort for a
Date Range: October 7th - October 14th. When looking at a period, the 7-day window "slides" for every day in that range. A user is included if they qualify for any of the dates within that span. On October 7: The system looks back to Oct 1, while on October 14: The system looks back to Oct 8.
As a result: The final data point for this weekly period reflects any user who was "active" within their respective 7-day "lookback" window at any point during that week.
- Rolling backward between: Subjects are selected as long as they satisfied the Cohort conditions between X and Y days before the report's date range.
As an example:
We want to set a report for January 15th to see how many people used your app. You want to filter this specifically for users who renewed their subscription within the last 7 days, but not today. The cohort criteria in this case will be "Renewed Subscription" with a time window "Rolling Backward Between" 1 and 7 days.
As a result: A user to show up in the report, the system "looks back" at the window between January 8th (7 days ago) and January 14th (1 day ago). If they renewed their subscription during that 7-day window, they are included in the January 15th results.
- Rolling forward: Subjects are selected as long as they satisfied the Cohort conditions looking forward X days for any of the dates in the date range.
- Rolling forward between: Subjects are selected as long as they satisfied the Cohort conditions between X and Y days after any of the dates in the date range.
Creating a Cohort
In Kubit you're able to build Cohorts in two main ways:
Define Cohorts within the Cohort Builder
At times logic can be specific to a number of conditions or complex and requires an AND or OR condition to retrieve the correct subjects.
When should I use the Cohort Builder?
- You have specific criteria that you can build the Cohort off of.
- You have to create a Cohort with AND/OR logic to be exported or used on another report for further analysis.
- Example: All User IDs that streamed something an item AND enabled notifications.
- You want to create a Cohort and Sync it to other tools like Braze (add-on).
Define Cohort from Report Results
More common is to create or inspect a cohort from results within a Report (i.e. Query, Funnel, Retention) to isolate that specific subject population.
To create these cohorts:
- Select the data point you want to create the cohort from.
- Right click and select "Create Cohort" or "Inspect Users".
- Create Cohort will prompt you to Save this Cohort for reuse, if you simply want to investigate the users you can cancel this save and view the cohort definition.
Create a Cohort Using Filters or Segments
When you create a Report in Kubit you're able to define Cohorts you want to Filter or Segment by directly from the report builder.
You will have the same level of functionality here and Save these Cohorts for re-use as you'd like. This includes creating complex AND/OR logic within your Cohorts.
Example: Users who Enabled Notifications over the past 7 days AND Streamed at least 10 min of content in each day.
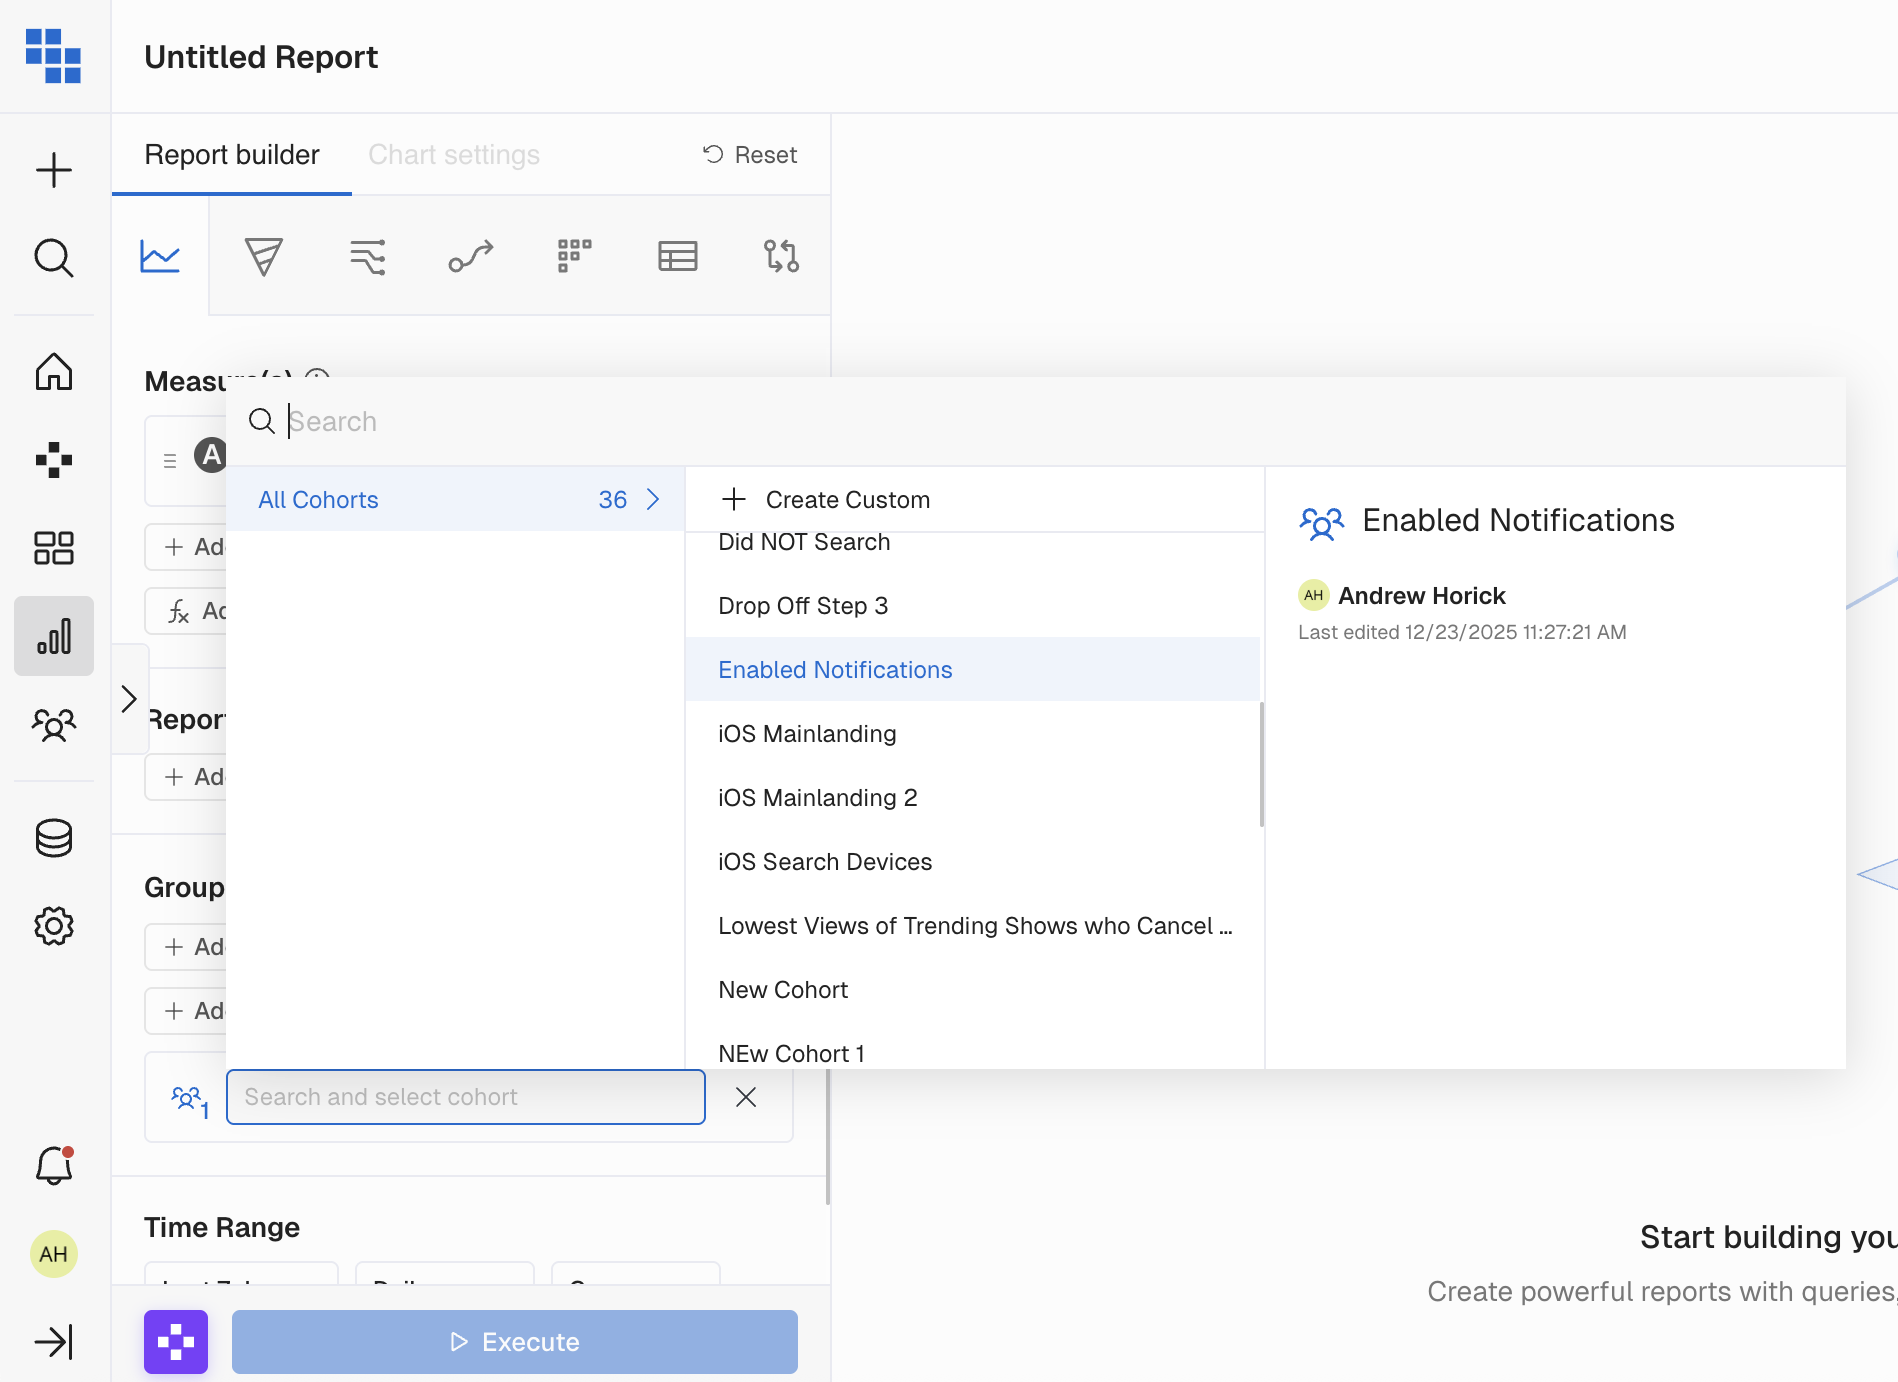
How to create a Cohort in-line in the Report Builder:
- Select if you want to build Cohort Filter in the Report Filter (or Measure Filter in Query) or Segment builder.
- Click "Create Custom" to open the Cohort builder modal
- Construct your cohort and give it a name. A name is required to add the Cohort to your Report.
- It will be added and designated with
{Name} (Unsaved)this means the cohort is only available for this report.- If you want to Save the cohort for wider use across other reports click on the Cohort name and then click "Save".
How to update a Cohort from the in-line Report builder:
- Click the Cohort name in the report builder to re-open the Cohort modal
- Make any adjustments you'd like to the Cohort logic
- Click "Update" to apply those changes
- Re-execute your report to display results with the updated Cohort logic
Fixed Date Cohort from Report
When creating a cohort from some report types you potentially could be talking about Subjects from one point in time and activity in another point in time.
Here is an example:
- User IDs who performed a Retention start event of "Sign Up" in May 2024, how many of those users were retained through Month 2 (July 2024)?
In this example Users had to have performed "Sign Up" in May 2024, this is your Cohort Date, and you want that group of users to be analyzed for activity into July 2024. In Kubit we allow you to do this by setting a fixed Cohort Date to ensure accurate results.
If you choose to remove the fixed dates and want to inherit the dates from the report you use this Cohort with click the "x" next to the date range.
Saving Cohorts
Once you've created a Cohort and want to save the logic as a Named Cohort you have two options.
Save a Cohort from the Cohort Builder
You're able to Save a Cohort multiple ways:
Save from a Report
When you left click into a data point and select Create Cohort you will create a Cohort of users represented in that single data point. This Cohort will have a Fixed Date Range in it's definition, the date range will be consistent with the timeframe of the selected data point.
Save from Breakdown Group
If you'd rather create a cohort from all subjects in a breakdown group you will click the vertical 3 dot menu next to the breakdown group. Then select Create Cohort and this cohort will include all subjects in this breakdown group for the entire date range of the report. This Cohort will have a Fixed Date Range.
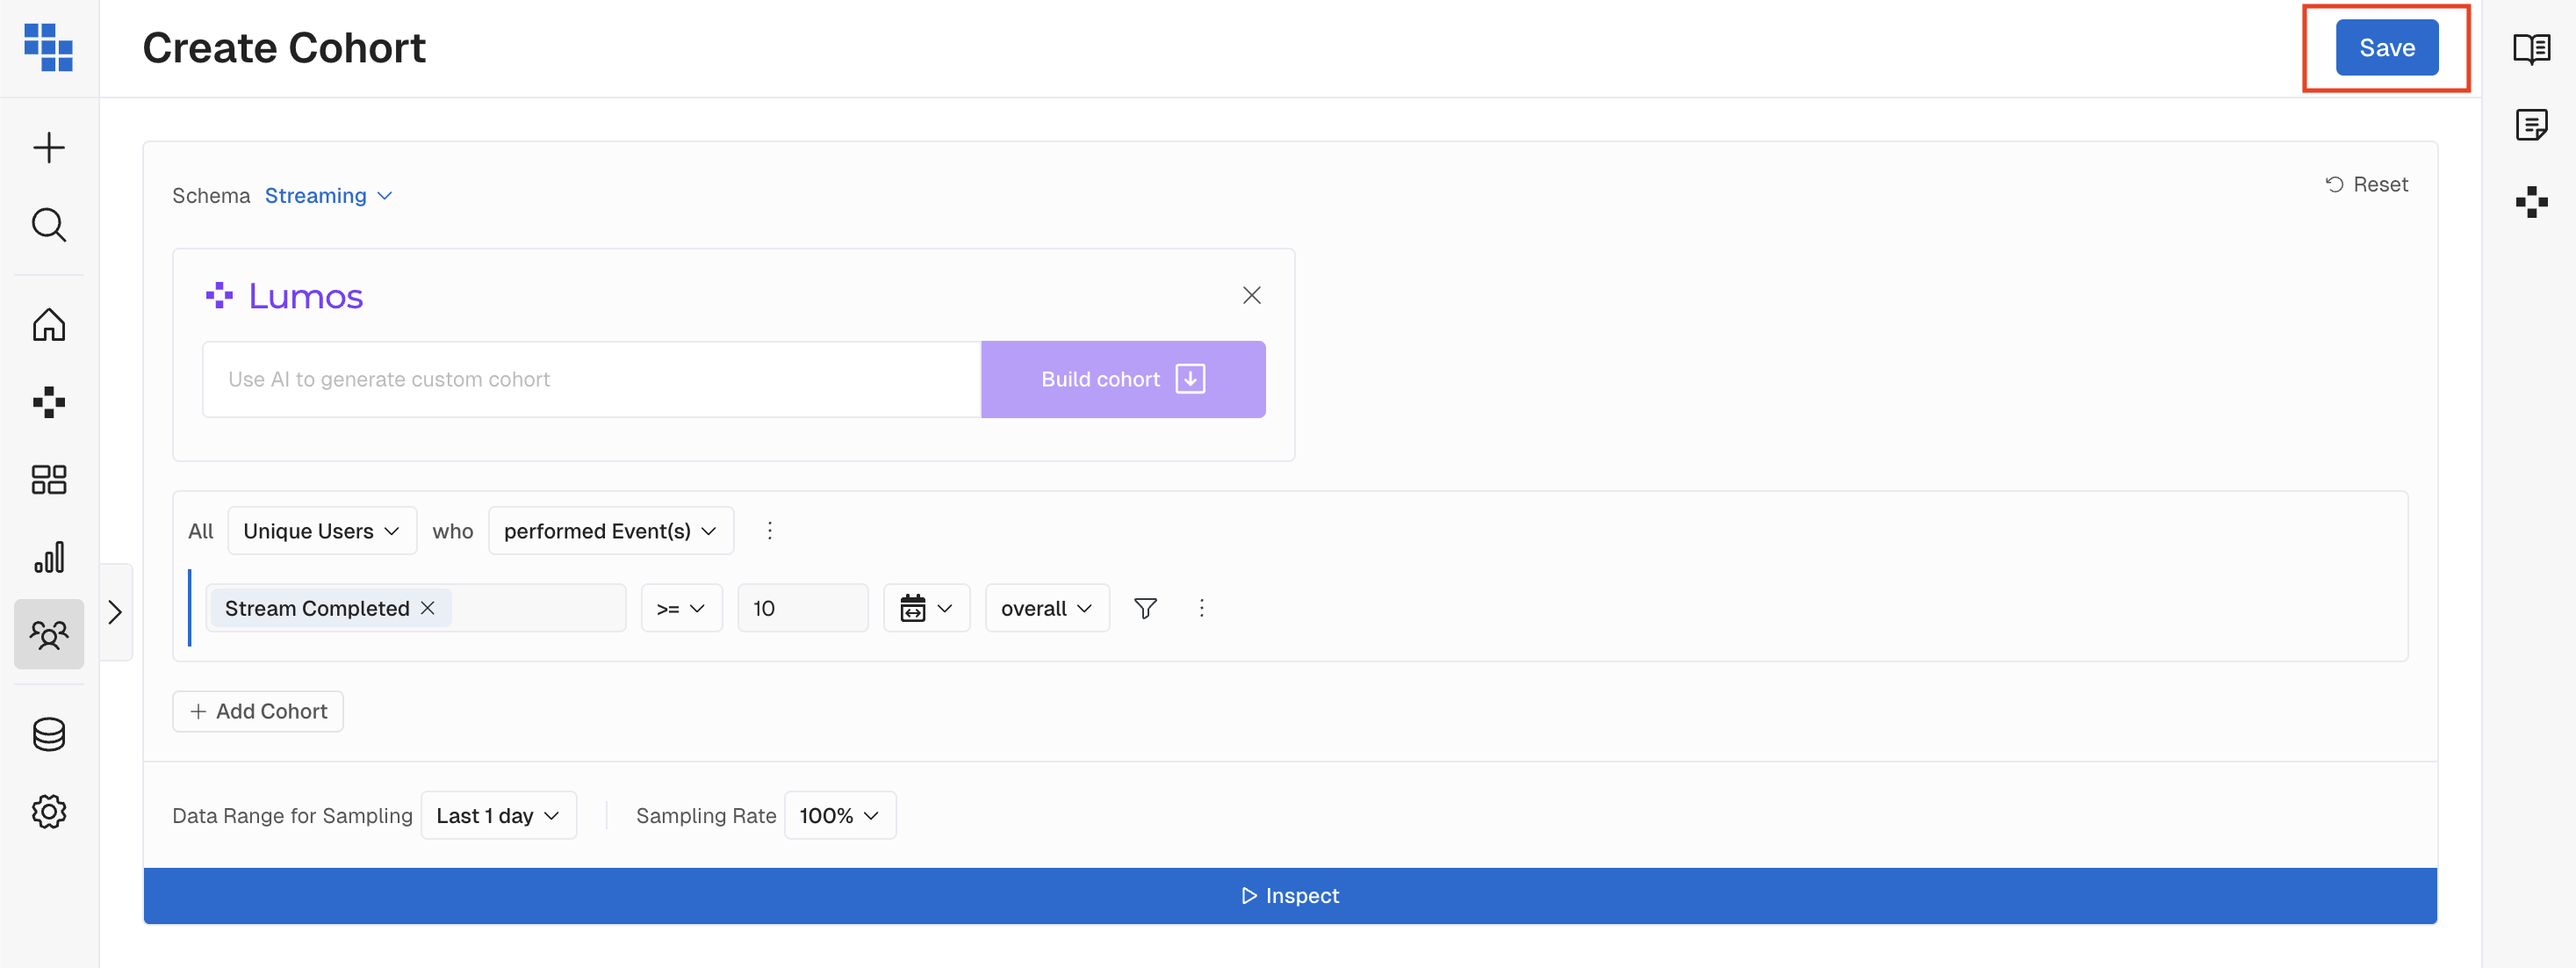
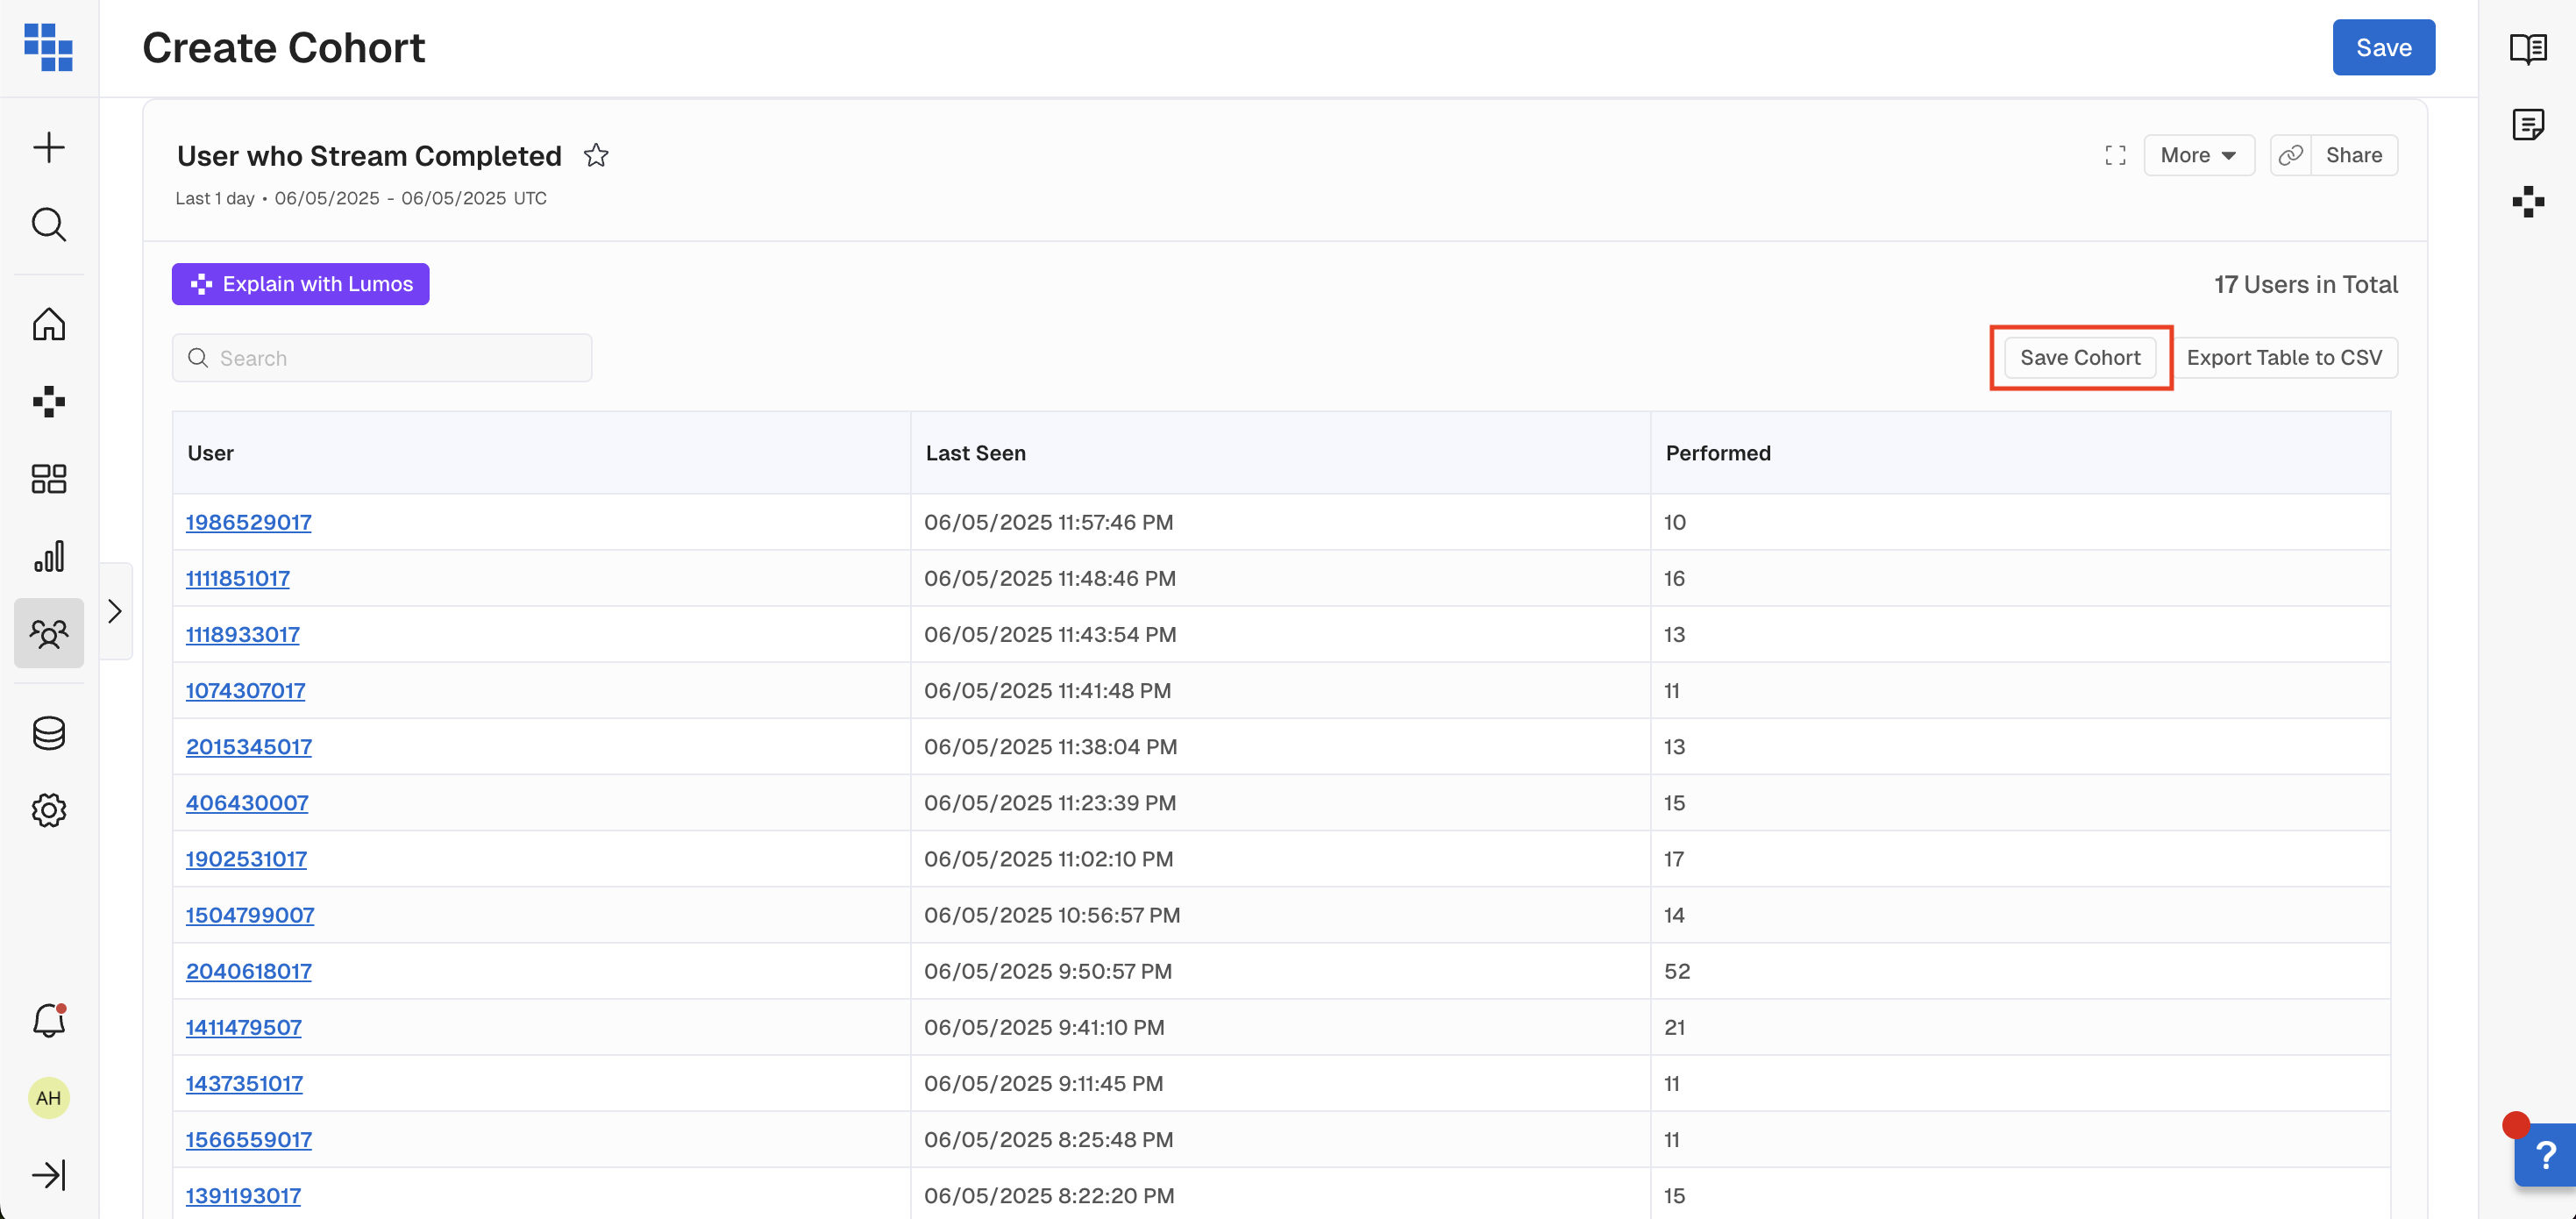
Save from the Cohort Builder
If you're building your Cohort from the Cohort Builder, once you've clicked Inspect you will see a "Save Cohort" button in the top right corner of the resulting table. Click this and name your Cohort, add a description and then Save it. You can also save a Cohort from the vertical 3 dot menu inside of the builder.
In Cohort Builder
In Cohort Results
Percentile in Cohorts
When creating a Measure or Query Cohort you are able to limit the Cohort to a percentile.
This will allow you the ability to segment high or low value Subjects within your Cohort.
- Top 5% of Users performing the Purchase event for items > $100
Compare Cohorts
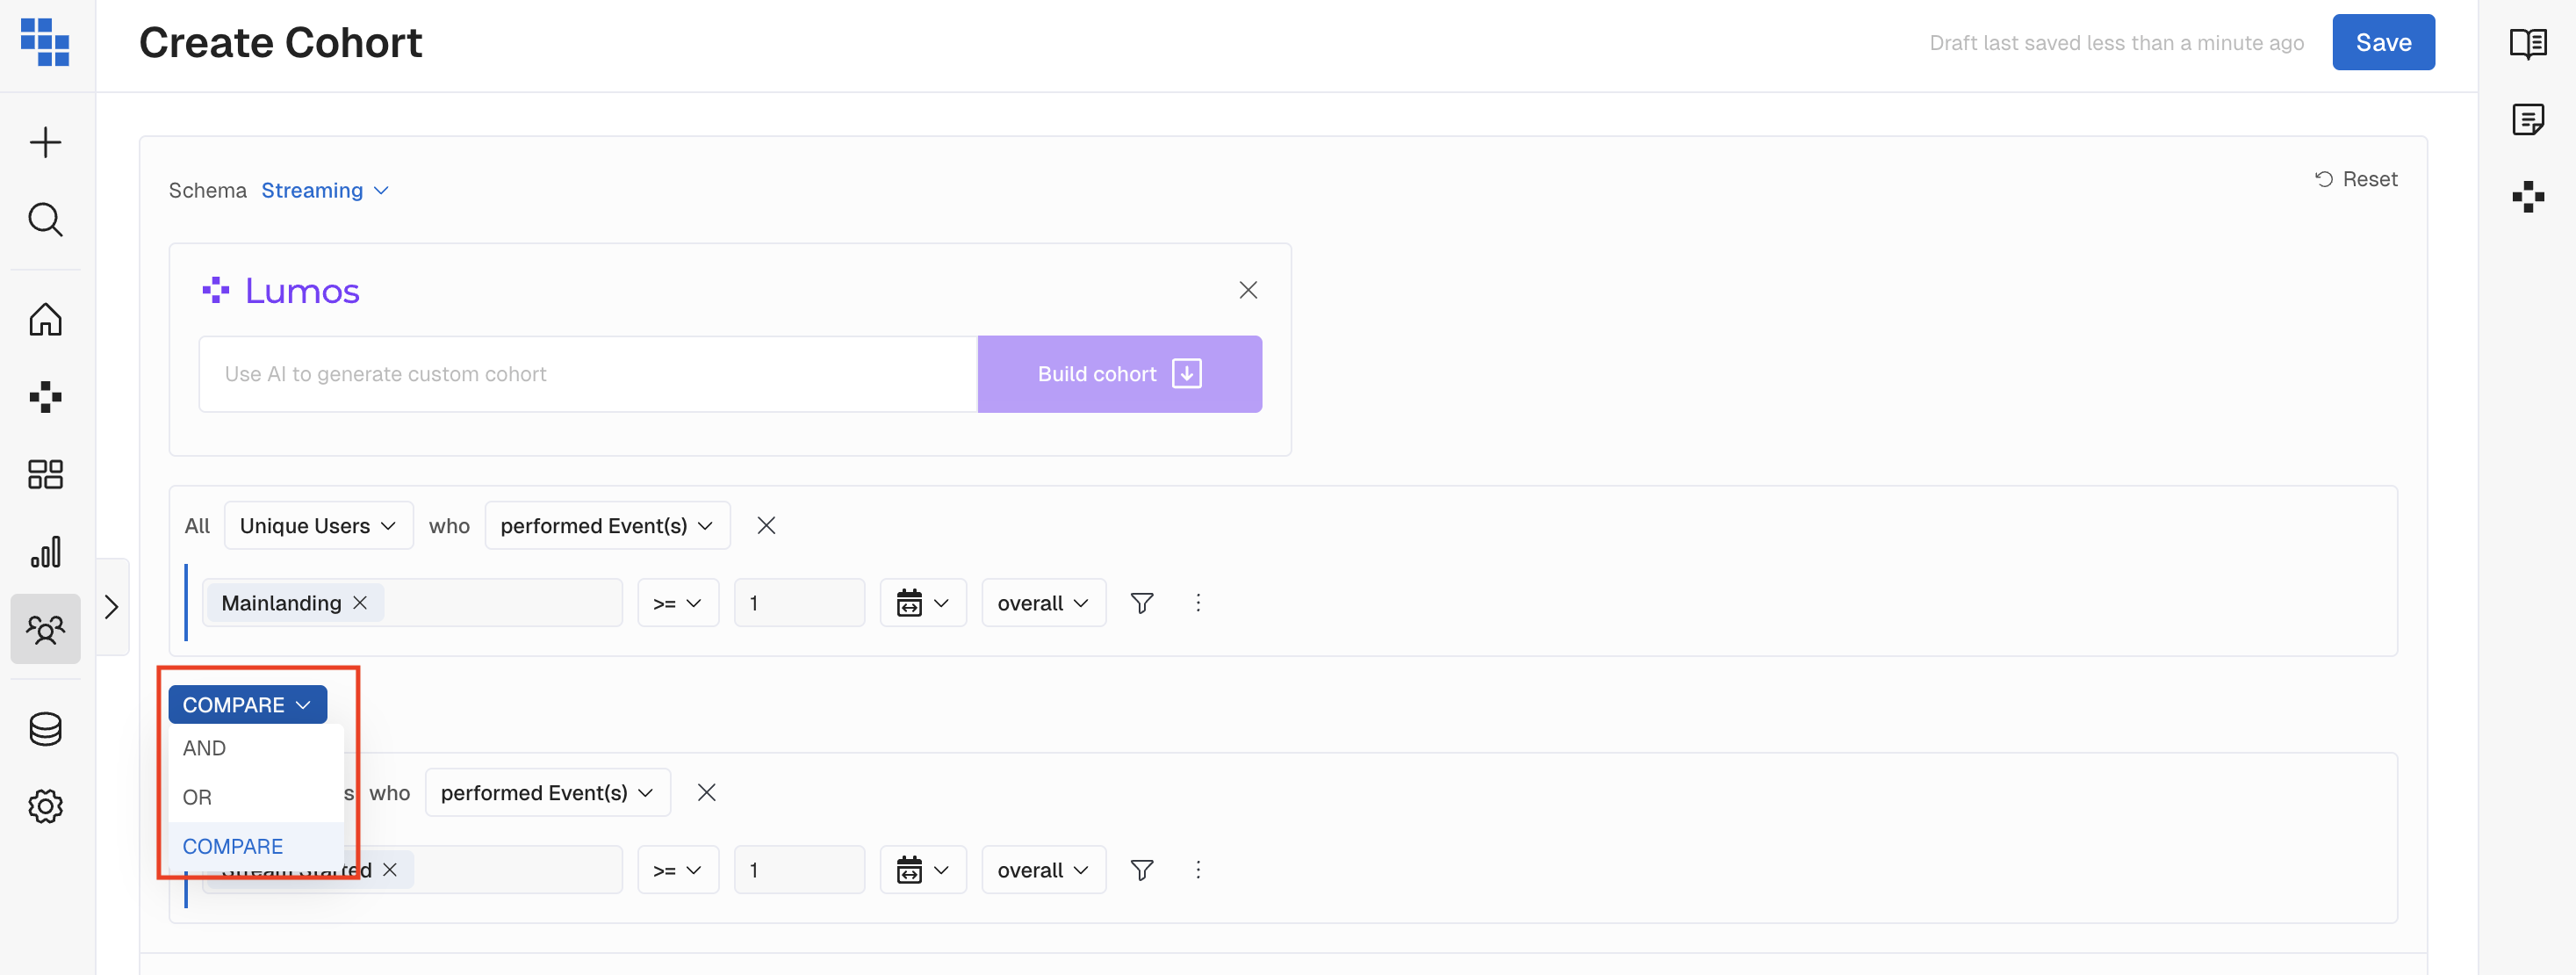
When creating Cohorts of users it often becomes valuable to understand what events users from one Cohort are doing more or less frequently than another Cohort. Kubit has created a way to do this directly in the Cohort builder. We will compare these two cohorts by using Average Events per User.
When building a Cohort and you want to compare it against another, simply add another Cohort to your analysis, select the date range you want to Compare and use the dropdown to select Compare.
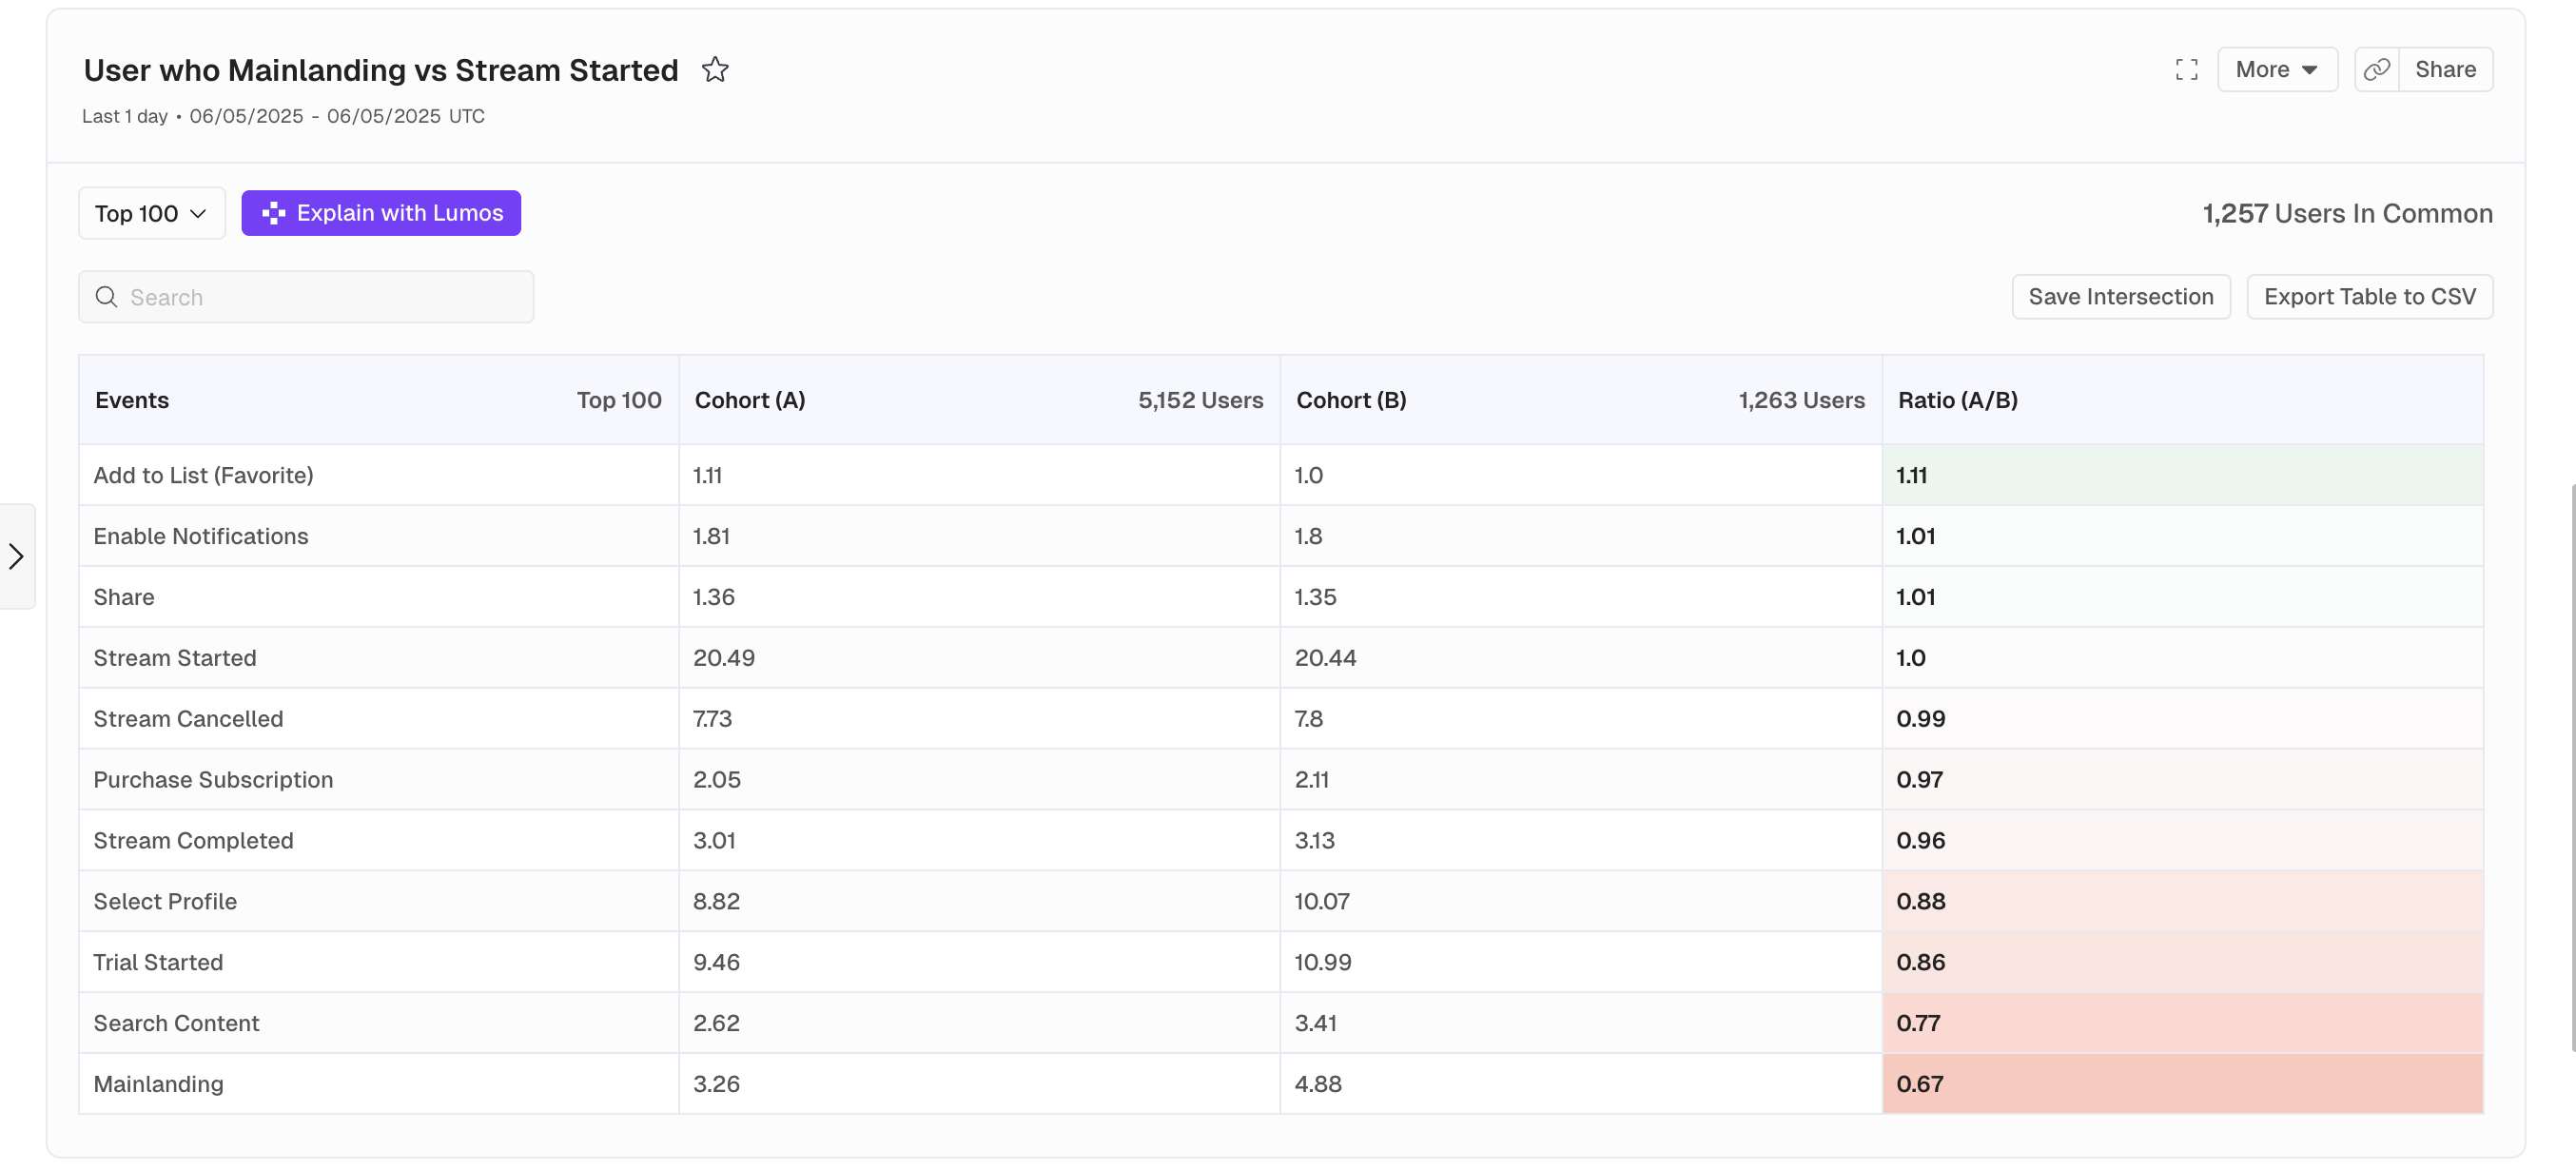
Cohort Compare Results
The resulting chart will give you the following information:
- Top 100 or Bottom 100 Events for the first Cohort, we call it "Cohort A". This is determined by sorting the Ratio of Avg Events per User between the two Cohorts.
- The name of the events in the Top or Bottom events per user.
- Cohort A information and the Avg Events per User for that Cohort.
- Cohort B information and the Avg Events per User for that Cohort.
- The Ratio of Cohort A vs. Cohort B with smart coloring to quickly show events Cohort A performs more often (Green) or less often (Red) than Cohort B.
Inspect User
Let's say you are trying to troubleshoot error scenarios. You already figured out there is a user journey which ends in an error and you found that using Path. But you need another level of detail in order to reproduce the issue. You can now put all the users (or whichever Subject you've selected) who hit this error scenario in a Cohort and see the actual event data for each user. This can help you narrow down what exactly went wrong so you can fix it.
You will define your Cohort criteria and click Inspect:
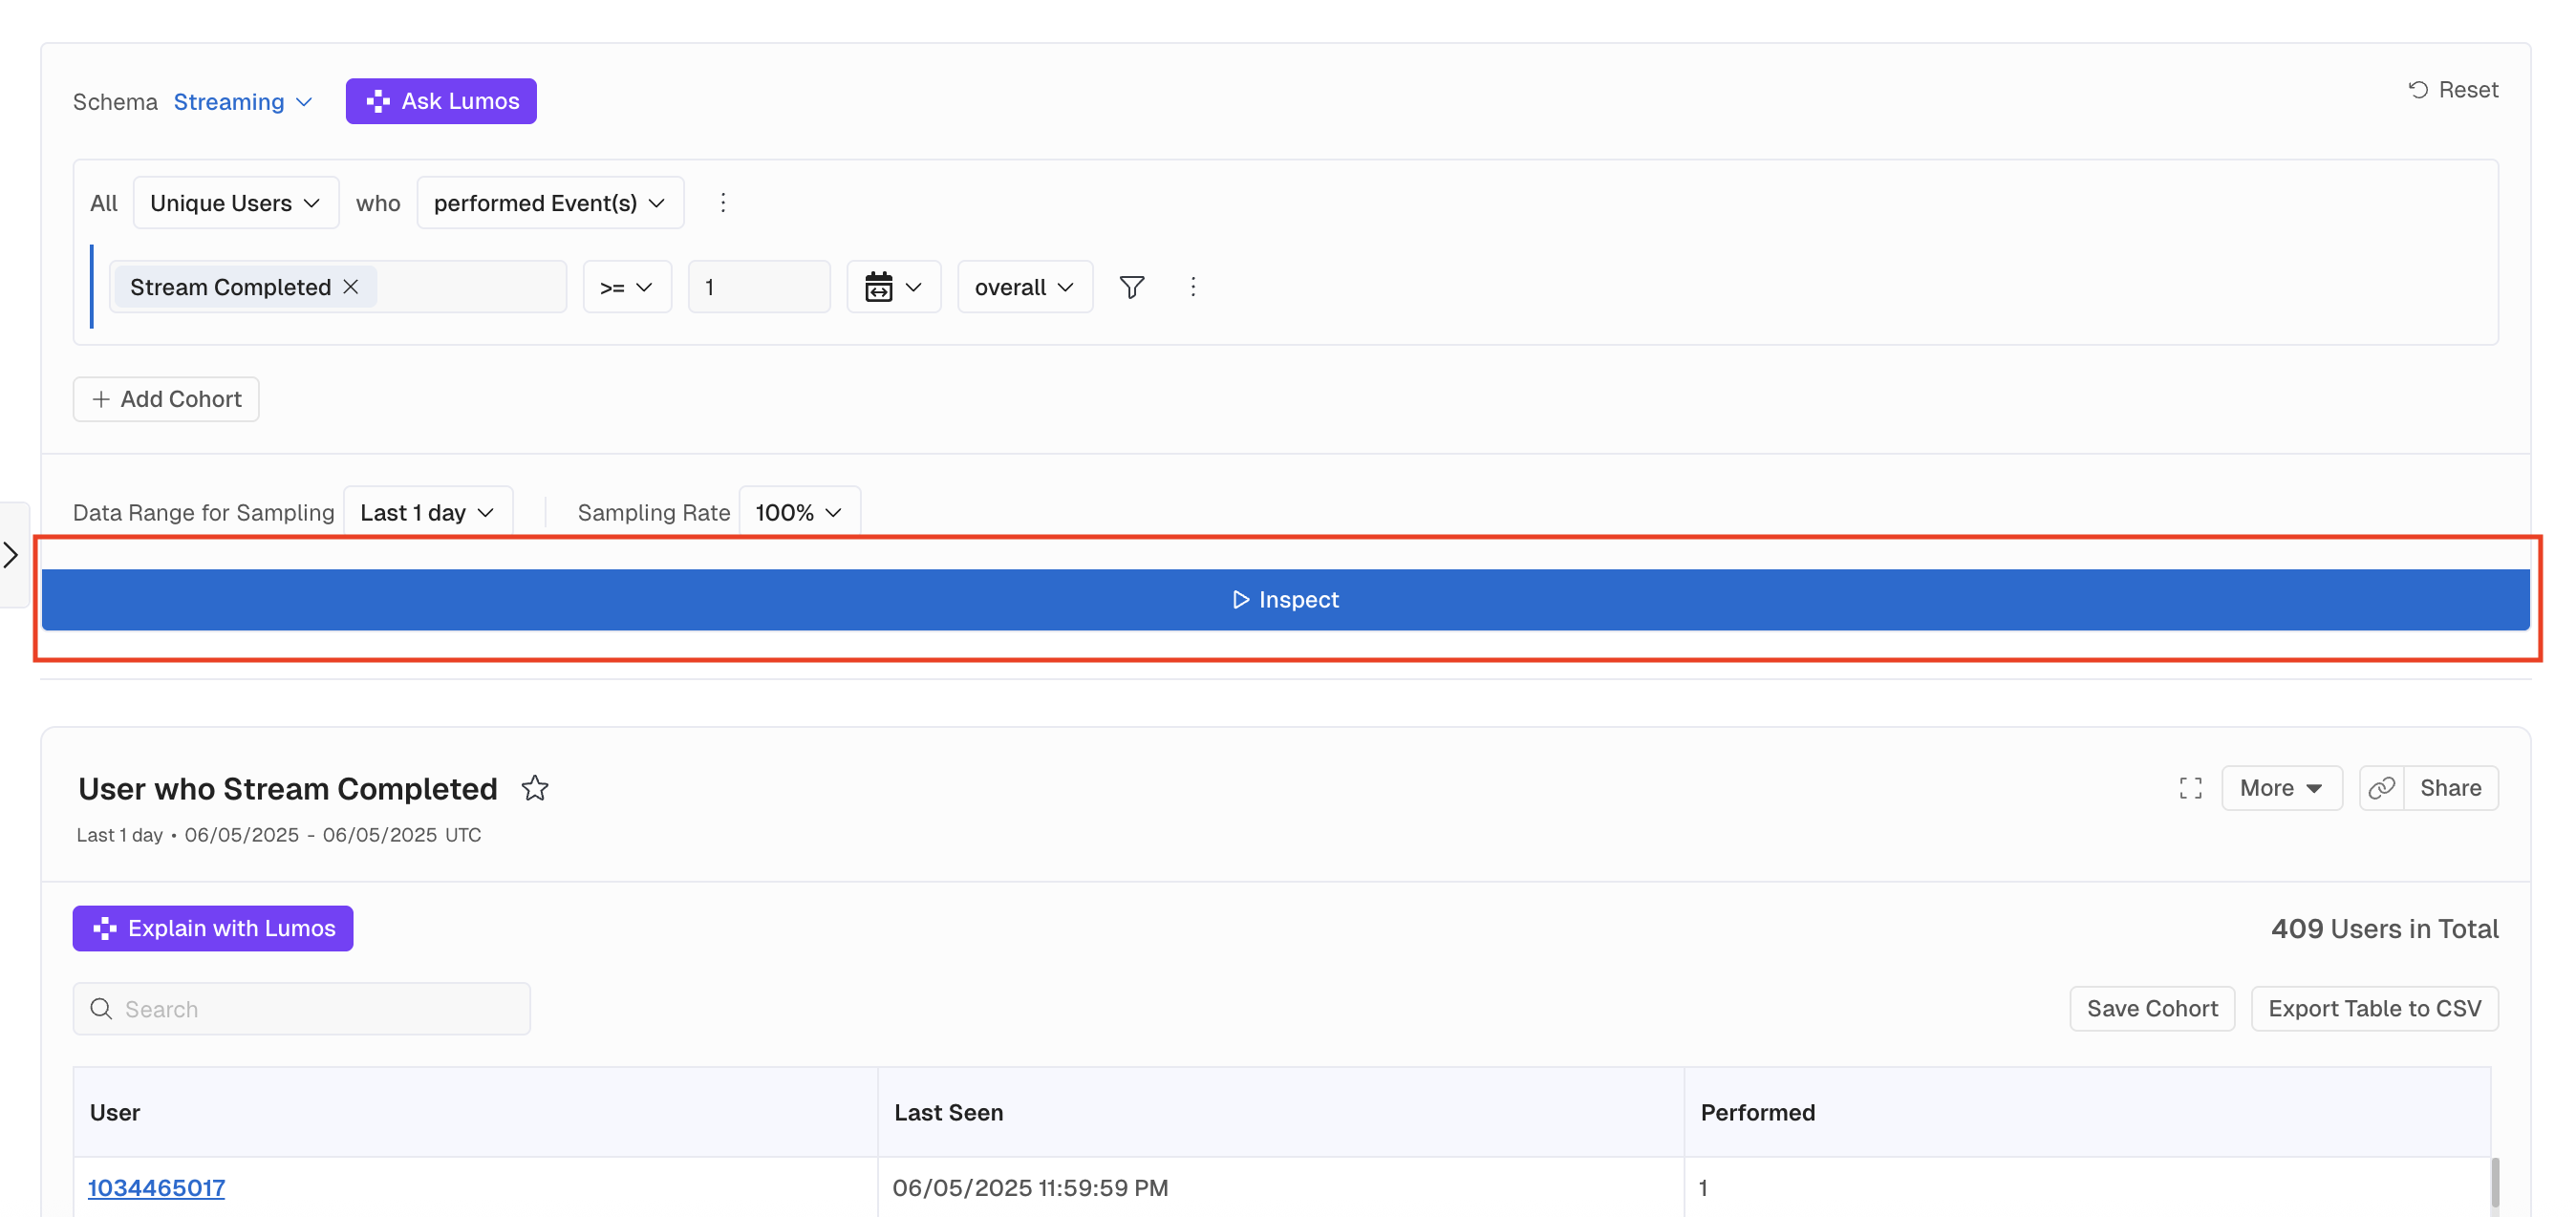
Then, you can click on any of the user ids in the resulting to see the event data associated with that subject's id.
All data in the Inspect window will be sorted descending by Event Timestamp (the first column). You are able to change the sort of this or any column by clicking the column header.
How to Leverage Cohorts in Other Charts
Cohorts can be used in any Query, Funnel, Retention or Path as a Filter or Segment Breakdown.
Wherever a Segment is applied, customers can also choose from a list of Cohorts.
- Similarly to dimension values in Segment, each cohort is a “slice” in the returned data structure. In the UI, a Cohort is displayed in the same way as a group in a Breakdown when displaying the data in a chart.
Updated 5 months ago