Components of a Report
Master report building with Subjects, Measures, Filters, Breakdowns, and Cohorts—learn how to create, save, and reuse components to build consistent, powerful analytics across all report types.
Kubit allows a lot of flexibility in what you create and how you can use and reuse it. When you build a Measure, Filter, or Event and then possibly want to access it multiple times this article is for you!
Subject
A Subject can vary depending on your use cases. They are customized to your specific data model and can be updated or added to as needed.
Common Subjects Include:
| General Subjects | B2C Subjects | B2B Subjects |
|---|---|---|
| User ID | Store ID | Organization ID |
| Session ID | Product ID | Contract ID |
| Visitor ID | Purchase ID | Product ID |
| Device ID |
Examples in Kubit:
- Query: Count unique User IDs performing an event.
- Funnel: Analyze Visitor ID conversion through a funnel.
- Retention: Examine Customer ID retention rates.
Measures
Measures are only available in Query and Data Tables. They include one Function (e.g. "Count Events" or "Unique Users") applied to at least one set of Events each can have its own Event Filters.
Create a Measure
Build a new Measure within each report type as needed.
Duplicate a Measure
If you want to create a separate measure similar to the one you have, you can easily duplicate and then change the parts you want.
Compound Measures
If you need to add or divide two measures, check out the Compound Measures section of our Query article to learn more about them.
Saving and Updating Measures
When Measures are complicated or defined business logic, it may be hard for everyone across multiple teams to remember all the details. Luckily, it only has to be defined once and can then be saved in Kubit.
- Build and execute the Measure.
- Click the vertical 3-dot menu under the report visualization.
- Select "Save Measure."
- Complete all necessary inputs and apply any necessary formatting.
- Click Create or Update depending on what you intend to do.
Saving requires appropriate permissions. Contact your Kubit Admin if needed.
Filters
Filters are the constraints applied during your analysis to limit the results. There are two ways to control the filtering in your queries:
Event filter: Applies to selected events. Click the funnel icon to create a filter.
- These filters will be to the right of each event you've selected. This means only that event will be filtered by the conditions you set. Click on the funnel icon beside the event to begin creating your filter.
Global filter - These filters appear below all the measures or query definitions. The filter types you see depend on the report you are working on. To begin creating your filter, click on + Add Filter, and choose the filter type. There are Global, Cohort and Measure filters.
- The first is Global and allows you to add filtering using the same approach as with the event filter, but it will apply to the entire report.
- The Cohort can be used to filter results by a cohort that you might have previously defined. Check out how to create a cohort .
- The Measure filter allows you to use groups of events. See how to how to create and save a measure to learn how to create groups of popular measures that can be re used.
🎥 Watch our Filter Training Video
They will filter the results for the entire query and all events included.
Create a filter
Creating or modifying a filter works the same way in all areas of the Report Builder. You click to create a filer, then choose the properties mentioned below. Once you click on Confirm, you'll see it in the Report Builder. To make changes, simply click anywhere in the defined filter. You can toggle AND/OR right on Report Builder. No need to enter an edit screen.
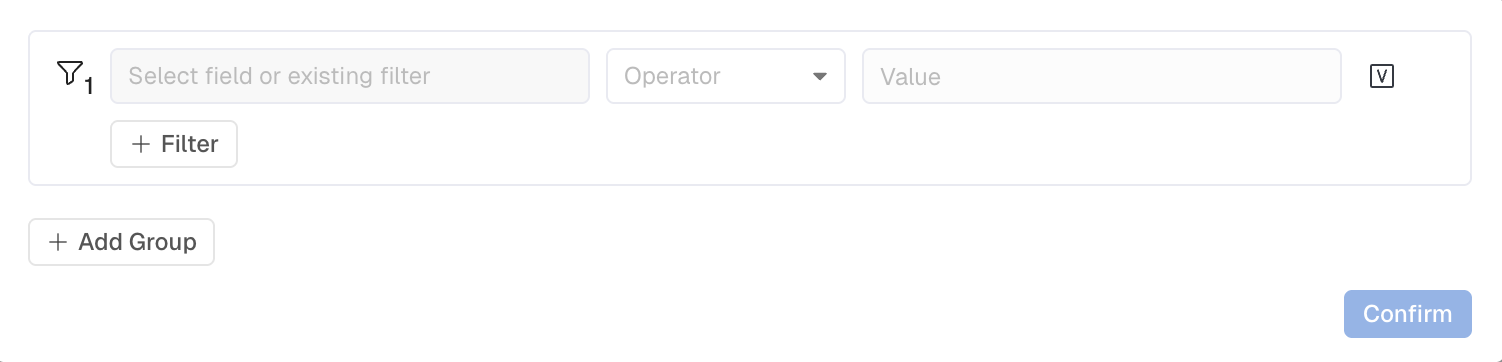
Each filter contains four parts: Field, Operator, Value(s) and + Filter.
Field: a field of the data model. For example: 'App Version', 'Device Name', 'OS', 'User Type'.
JSONorBigQuery Structfields can expose their internal data for filtering or breakdown through Nested Properties.
Operator: the logic of when to include/exclude specific values
| Operator | Type | Definition |
|---|---|---|
| = | String or Numeric | Exactly equals. |
| != | String or Numeric | Does not equal or is NULL. |
| < or <= | Numeric | Greater than. Or, Greater than or equal to. |
| > or >= | Numeric | Less than. Or, Less than or equal to. |
| between | Numeric | Between 2 values, inclusive. |
| exists | Boolean (True / False) | Check if the field contains data. If you want to check if the field is NULL you would select exists = False. |
| contains | String | Value in the filter is found within the field column. |
| not contains | String | Value in the filter is not found within the field column. |
| starts with | String | The starting text of the data matches the filter. |
| not starts with | String | The starting text of the data does not match the filter. |
| ends with | String | The ending text of the data matches the filter. |
| not ends with | String | The ending text of the data does not match the filter. |
| matches | String | The filter value exactly matches the field data and is case-sensitive. |
| not matches | String | The filter value does not match the field data and is case-sensitive. |
Value(s) : Depending on the Field data type and selected Operator, there can be multiple values to be selected from a list of lookup values, or manually entered. This means selecting multiple values from the drop down will result in an OR condition on these selections. For example: I create a filter like platform = "iOS, Android" I am selecting rows where the Platform field is "iOS" OR "Android" in order to be returned.
+Filter: Adds another filter, which you can choose to make either an AND or an OR.
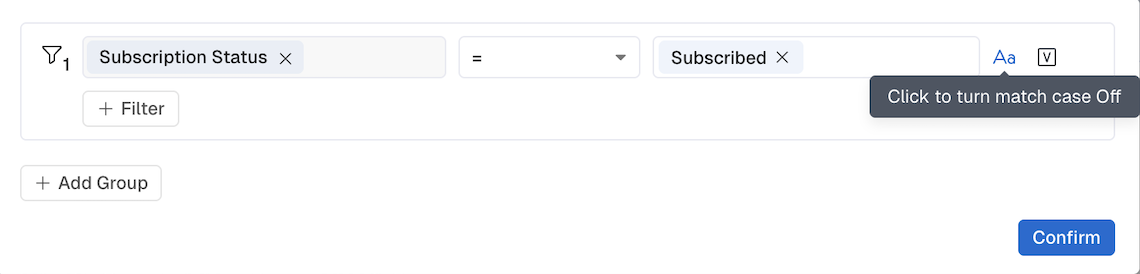
Case Sensitive Filters
In Kubit we default to text filters being Case Sensitive, meaning if you filter to subscription_type = 'Premium' then the underlying data must have the capital 'P'. If you have instances where the cases are mixed within a column you can disable case sensitivity by clicking the "Aa" button.
If it's blue then it's enabled and grey is disabled.
Filter Against Other Fields
Occasionally it's not a specific value you want to filter by but rather if the value of Column A = the value of Column B. In Kubit you're able to do this by clicking the "V" button and selecting the column you want to compare in the filter logic.
Filter Groups
Both Event Filter and Global Filter support up to three Filter Groups which are connected with a logic operator AND/OR. You can think of each Filter Group as a parenthesis.
Saving Filters
Similar to other items, if you find yourself creating the same filters or they are complex you can save them and give them a more meaningful name by clicking the vertical 3 dots that appear next to the filter. Once saved you can reuse this filter across all charts.
Deleting a Named FilterTo delete a Named Filter you must go to the Dictionary page and then to Filter. Locate your filter and then delete it.
Breakdown
When you're analyzing data it's important to be able to slice it by various attributes of the User or Event. Breakdowns allow you to group the results by these fields and even Bin them into more meaningful groups in Query .
Breakdown by a Field: Select the field you want to break down by to see results grouped based on the values of that field. These can be things like "User Type" or "Subscription Mode".
🎥 Watch our Breakdown Training Video
Custom Binning
-
Breakdown with Binning
- When you'd prefer to group values inside of the breakdown into groups or "bins" we've made that available in the Breakdown feature.
- Select the field you want to break down by and click the context menu to expose "Add Binning"
- You can bin items based on their values, Value Binning, or ranges of integers, Range Binning. Based on the data type you've selected you may see only one or both.
-
Saving Named Binning
- Once you've created your bin you can save it for reuse by clicking the down arrow in the top right corner of the bin groups above the first bin.
Overall
When you apply a breakdown in Kubit, we will distribute the results of a Measure or Report based on the value of the field you're breaking down by. However, we also want to return the Overall results outside of the breakdown to give you a proper view into how many rows or subjects are being included.
Next to the Group By section header you will see a toggle for Overall. When a breakdown is added to a report Overall is toggled Off by default.
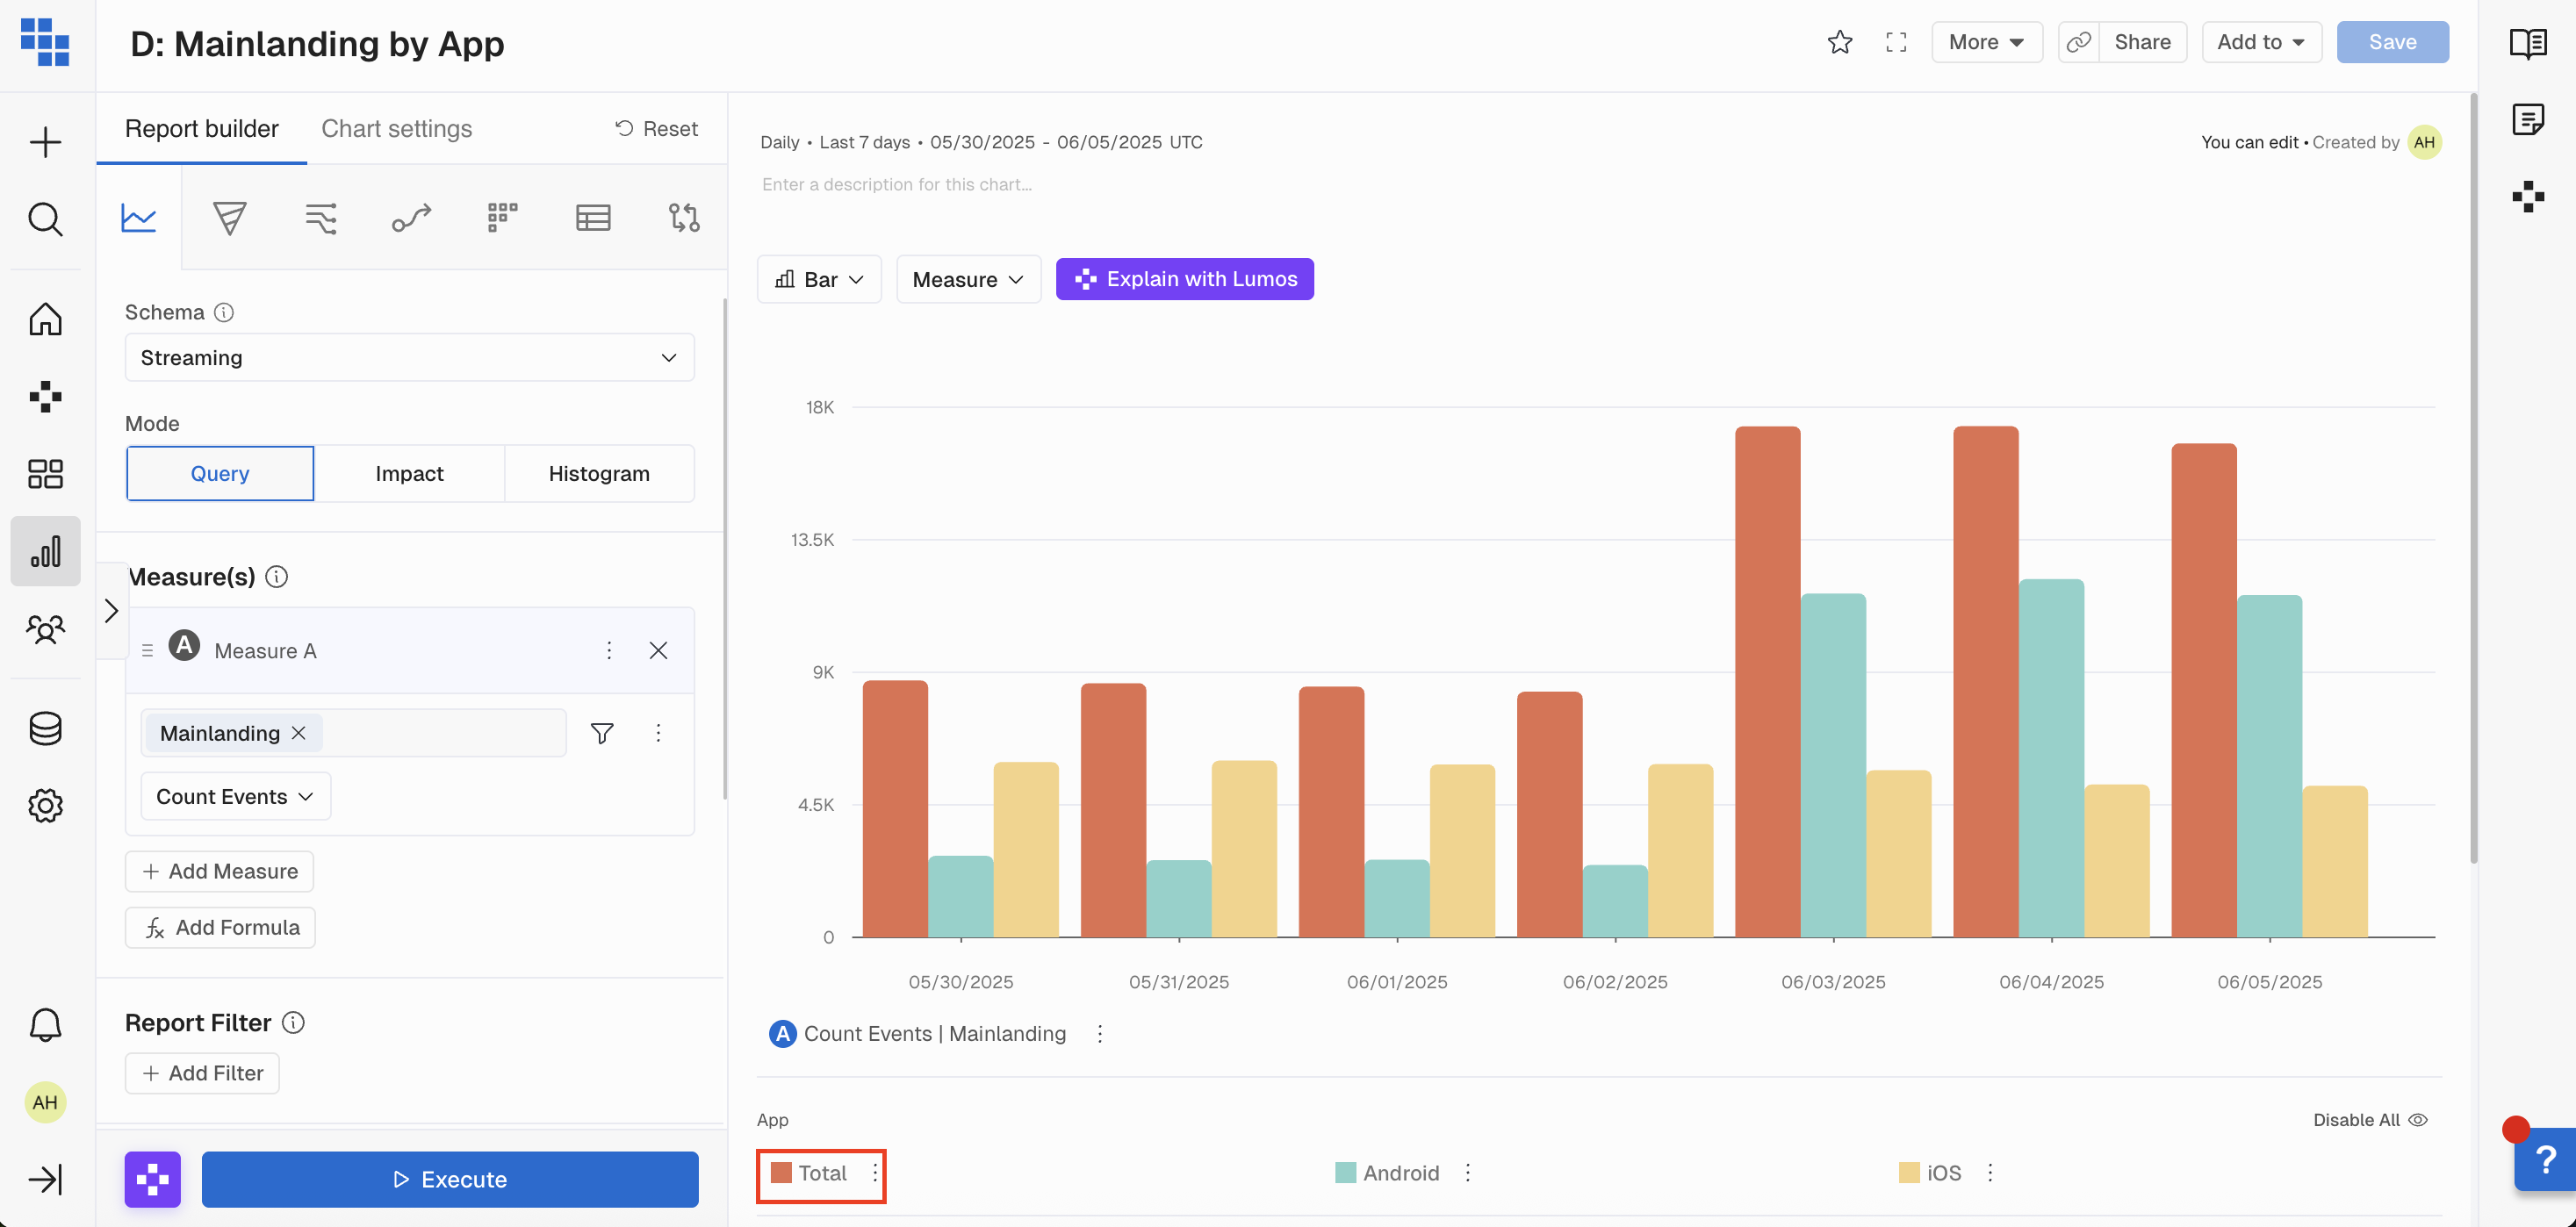
For Query reports we will return a Total result if Overall is toggled Off. This allows Kubit to calculate % of total, pie, and area charts. Other report types like Funnel or Retention you must enable Overall to see it as a separate result.
How should I interpret results when Overall is toggled Off?
When you execute the report with Overall turned Off the "Total" result will be a simple cumulative sum of all the values within your results based on the time frame you're using.
- Example: If you're looking at a breakdown by App with Overall turned off by Day, the Total bar will be a sum of each App group for each day.
- This means if a user visited your product on both iOS and Android devices they will be counted twice in the Total bar.
How should I interpret results when Overall is toggled On?
When you execute the report with Overall turned On the "Overall" result will be a separate query distinctly counting all the values within your results based on the time frame you're using. You may see a slightly longer runtime as a result of turning Overall On.
- Example: If you're looking at a breakdown by App with Overall turned On by Day, the Overall bar will be a distinct count of all users for each day.
- This means if a user visited your product on both iOS and Android devices they will be counted once in the Overall bar.
Why are my results different when Overall is Off vs. On?
When you turn Overall On you are running another query retrieving a distinct count of subjects without the breakdown applied. This means if a subject was a member of multiple breakdown groups they will only be counted once in the Overall result if it's turned On.
If the Overall toggle is Off we do a simple cumulative sum across the breakdown groups. This means if a user is a member of multiple breakdown groups they would be counted multiple times.
When should I turn Overall On?
It's best to turn on Overall when you want to understand % of totals where a subject could belong to several groups. We will still allow for % of total, Pie charts, and area charts if Overall is turned off but the denominator could be much larger than your actual population if subjects belong to multiple groups.
Enable/Disable Breakdown Groups
Within the Breakdown, you can toggle between having all of the groups Enabled or Disabled. The best way to think of this is if you want to remove a Group from the view OR if you want to focus in on a specific group or groups for deeper analysis.
Here is a quick example:
You want to see how many Stream were started by the Category of the content. You then want to disable certain Categories for a deeper look at certain categories. You can click to disable the Categories to remove. THEN you can reenable the view of all by clicking Enable vs each individual button.
Cohorts
Within each report type, you're able to add Cohorts of Subjects to breakout the results by if a Subject is a member of a Cohort. The best way to think of this is rather than breaking down by a value within a Field, you're breaking down by the behavior of a group of Subjects.
Here is a quick example:
You want to see the conversion rate of a checkout funnel but you need to see if the conversion rate is different for Users who have Enabled Notifications.
Enable Notification is an Event and not part of the checkout funnel...so how do you add this logic to your Funnel Report?
The answer: Cohorts
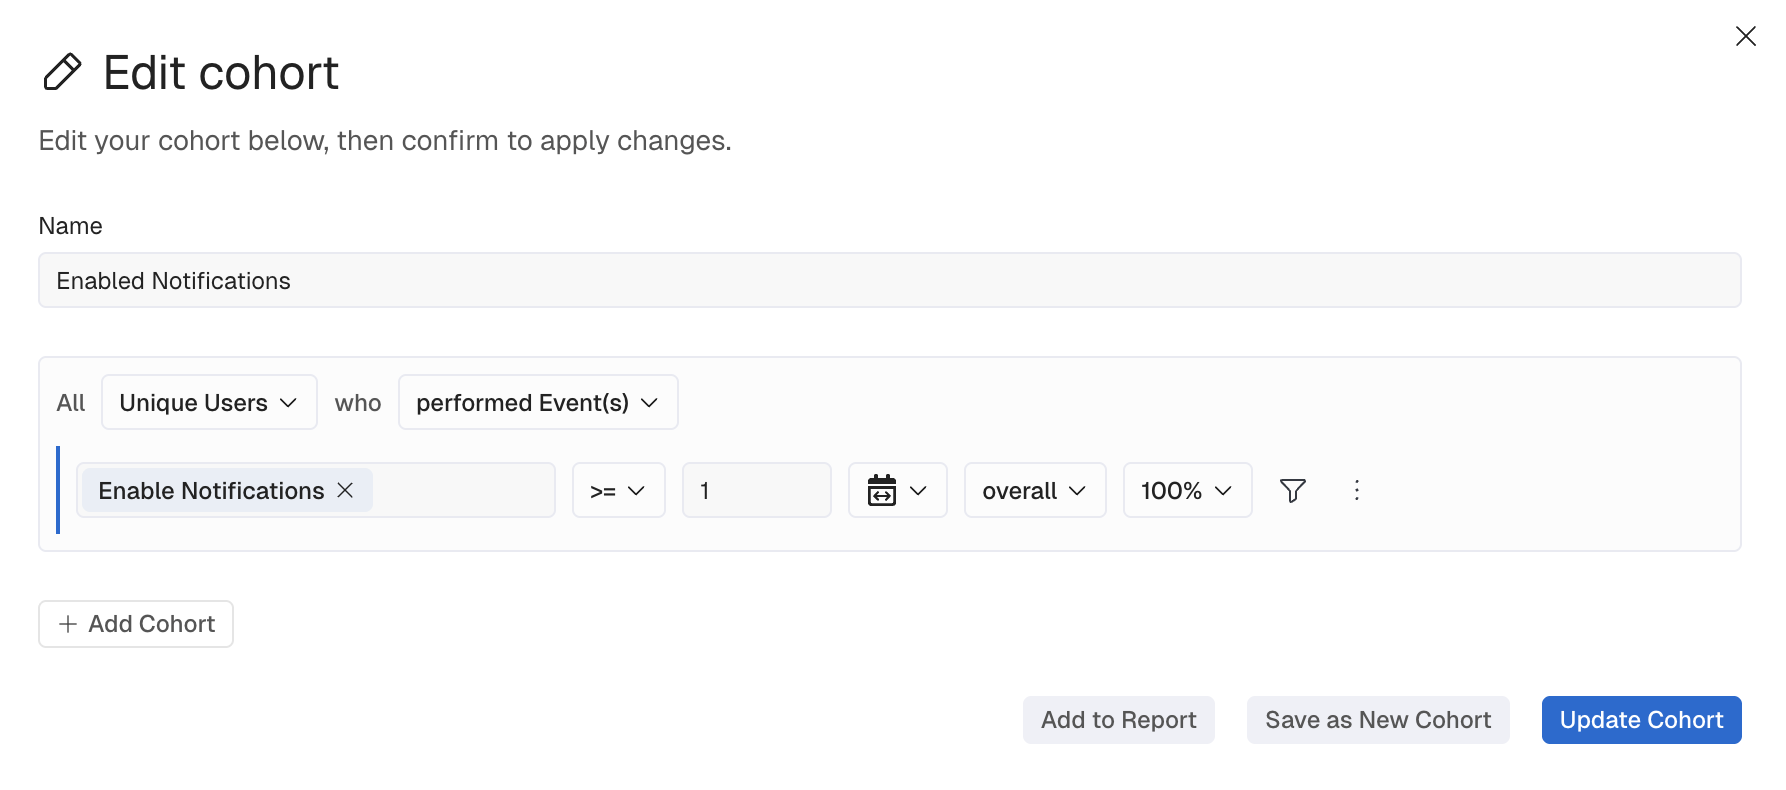
You will create a Cohort of Users who performed the Enable Notifications event and then compare it to the Overall group. You're also able to create another Cohort of Users who did NOT perform the Enable Notifications event and to ensure the groups are mutually exclusive.
How to Interpret Cohort Results
Once you've created the Cohort you want to break out by you'll see each Cohort denoted in the Report with its color. If each Cohort is using the same name or it's not very human-readable you're able to rename them by clicking on the action menu.
How to Rename Cohorts
To Rename a Cohort you will click the 3 dots next to the Cohort below the Report and then select "Rename".
Save a Cohort
If you've created a Cohort you want to re-use the best thing to do is create a Saved Cohort from it. You're also able to Save a Cohort from a specific date range within your report to investigate further.
Save Report Settings
After a report has been executed you're able to customize the visualization based on how you want the data represented.
These include:
- Report visualization type (i.e. show it as a line, bar, metric, or pie).
- Renaming your Measures.
- Hiding/Showing breakdown groups.
- Adding Measure Formatting (i.e. show the result as a percentage).
Once all modifications have been made you must Save your Report Settings. You can do this by clicking the Save button at the top right side of your Report.
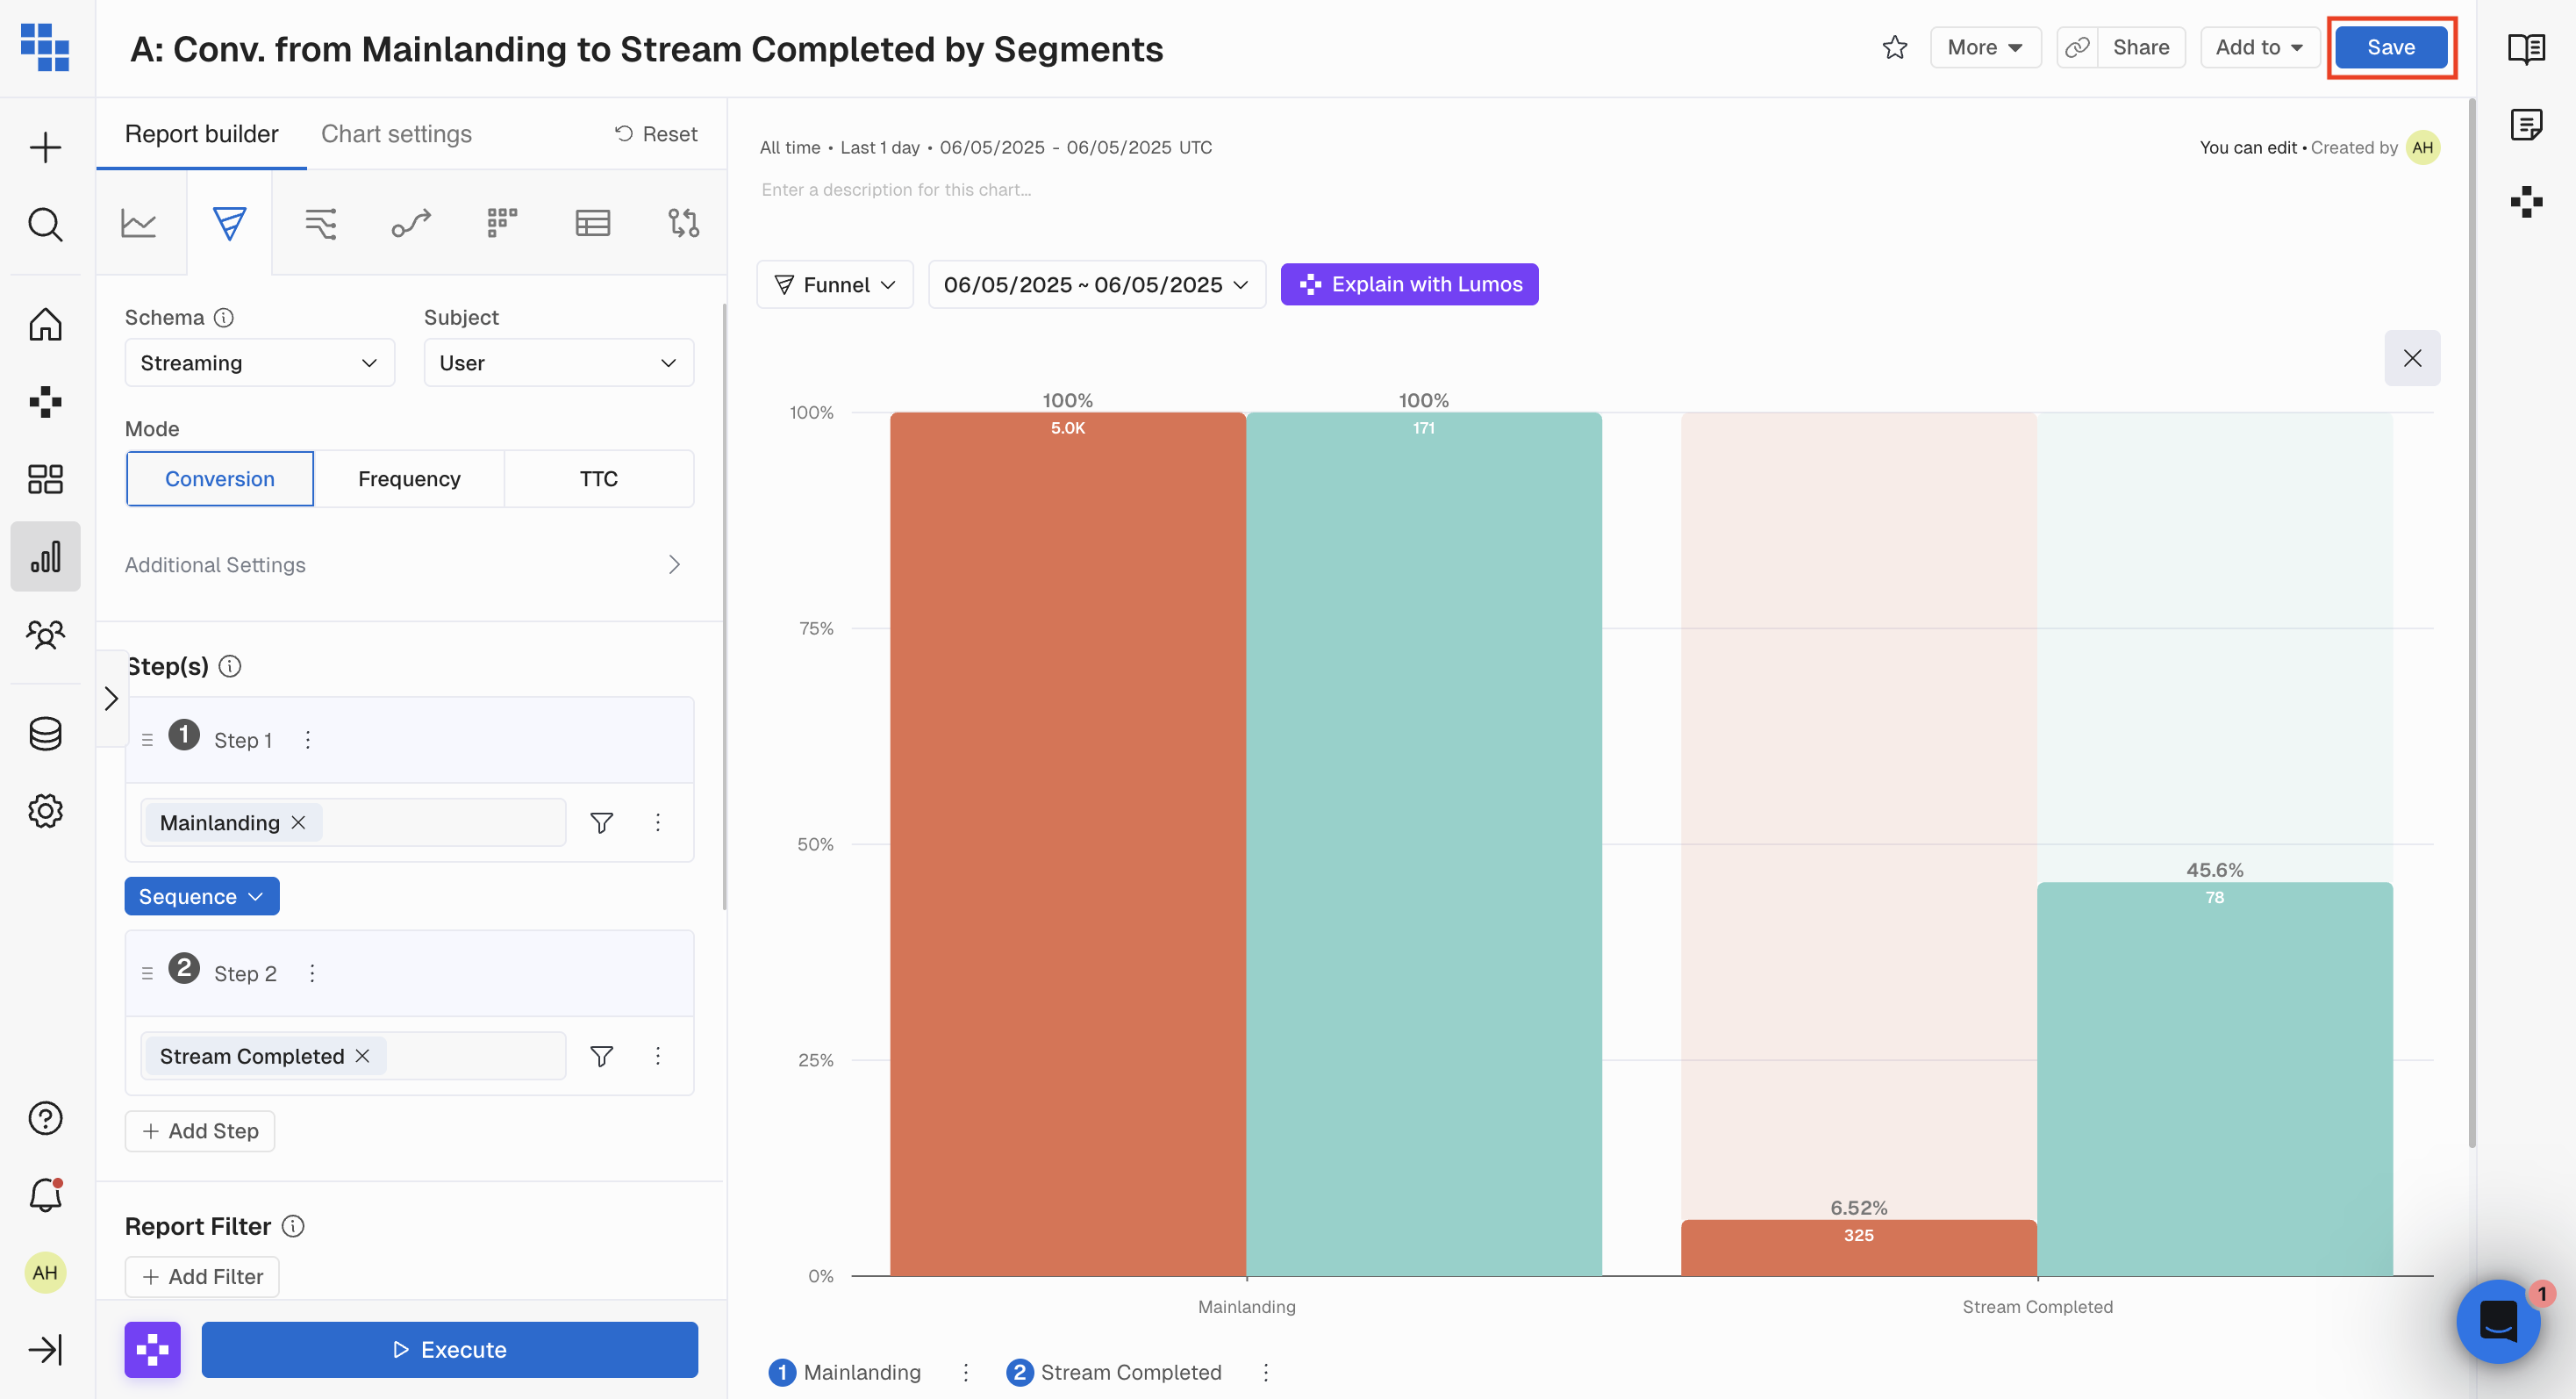
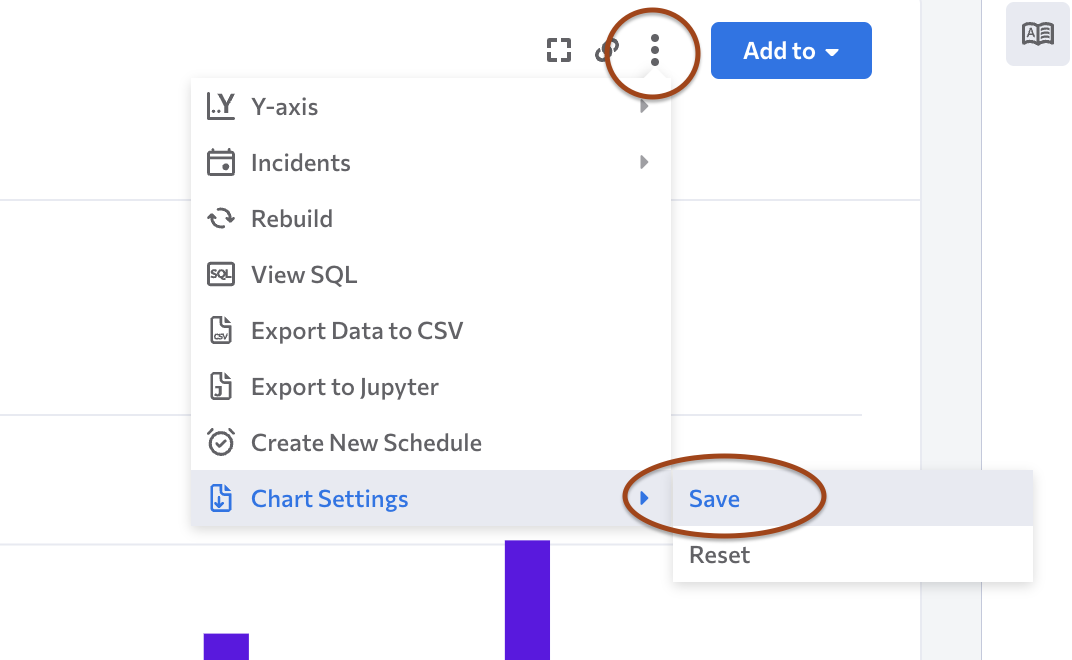
Chart Settings
Once a Query or Funnel chart has generated you have the option to adjust some of the chart settings by clicking on the cog icon.
Query Settings:
- Change your y-axis details from the left to right margin by selecting the cog icon, going to Chart Settings, opening Measure Assignments and select either Left or Right.

- Hide or unhide the y-axis by selecting Left Y-Axis under Chart Settings, and then select Visible or Hidden.
- Format your y-axis by selecting Left Y-Axis under Chart Settings, toggle on Apply Y-Axis Format, and then select the format you wish to use.

- Define y-axis bounds by selecting Left Y-Axis under Chart Settings and then selecting Auto, Truncate, or create Custom Bounds.
- Add a reference line by toggling on Reference Line. You can then select the reference line's label, color, and type (dash, dot, or solid).
Funnel Settings:
- Show conversion or count on the y-axis by selecting Funnel Assignments under Chart Settings and choosing your preference.
- Add the Conversion Rate by selecting Funnel Assignments under Chart Settings and toggle on or off Conversion Rate for your chart.

- Add the Bounce Rate numbers by selecting Funnel Assignments under Chart Settings and toggle on or off Bounce Rate in your chart.
- Hide or unhide the y-axis by selecting Left Y-Axis under Chart Settings and selecting Visible or Hidden.

Add a reference line by toggling on Reference Line. You can then select the reference line's label, color, and type (dash, dot, or solid). Keep in mind that if the y-axis is a percentage you will want to adjust your number accordingly. (ie: 60% would become ".60")

Tooltips & Inspect
In Reports, a tooltip will appear when users hover over the chart. These new tooltips feature:
- Support for Query, Funnel, Flow and Retention Report Types.
- Support for Line, Bar, Stacked Column, and Percentage Area visualizations in Query.
- Percent change between data points will appear on hover in Query Reports.
- For Line and Percentage Area charts, users must hover over a point on the chart to see the percent change.
- For Bar and Stacked Column charts, users only need to hover over the bar. This allows users to quickly grasp differences in data over time.
Left Click on Tooltips
Left click on all supported charts except Flow opens Create Cohort and Inspect User actions. You're also able to create an Incident directly from the Report. This helps other users see major disruptions or launches to explain shifts in the results.
In Flow, users can choose Select Path, Create Funnel, Combine with Others, and Combine with Others Globally. The Combine with Others option allows for a specific path to be hidden on the overall chart. In Query, you can also select Create Incident.
Next Steps
The Next Steps section allows you to take all of your Report's settings and bring them over into another Report Type.
This section is beneath the results once you execute your report.
All Measures, Filters, Breakdowns, Cohorts, and date ranges from one report can be brought over to the next. Select the Report Type you want to transfer your settings to in the Next Steps menu.
Updated 6 months ago