Funnel
Build powerful Funnel charts to measure conversion rates, identify drop-off points, and optimize multi-step user flows in your product.
Funnels are great tools for understanding conversion and drop-off rates for critical steps within your product.
Watch our Funnel Training Video
Funnel Use Cases
Our Funnel chart can be very useful in the following use cases:
- What percentage of my users converted on Step 3 of my onboarding funnel?
- What is my drop off rate after users hit a specific page in my product?
- How quickly do users convert from Steps 1-2 and 2-3 in my funnel?
- How frequently does a user perform Step 2 before moving to Step 3 of my critical funnel?
This is not an exhaustive list. We encourage use of the funnel to meet unique use cases that you might have.
Building a Funnel Basics
Funnel is a Formula used to analyze the conversion rates between multiple steps in a flow. Kubit counts the unique users at each step and allows you to visualize conversion rates based on your use case.
- Each step can have one or more Events with Filters.
- You can give a name to each step to make it easier to differentiate in the chart. If no name is provided, default step names such as the event name will be used.
- You can add or remove steps using the controls on the left side.
- You can also drag-n-drop steps to re-arrange their order.
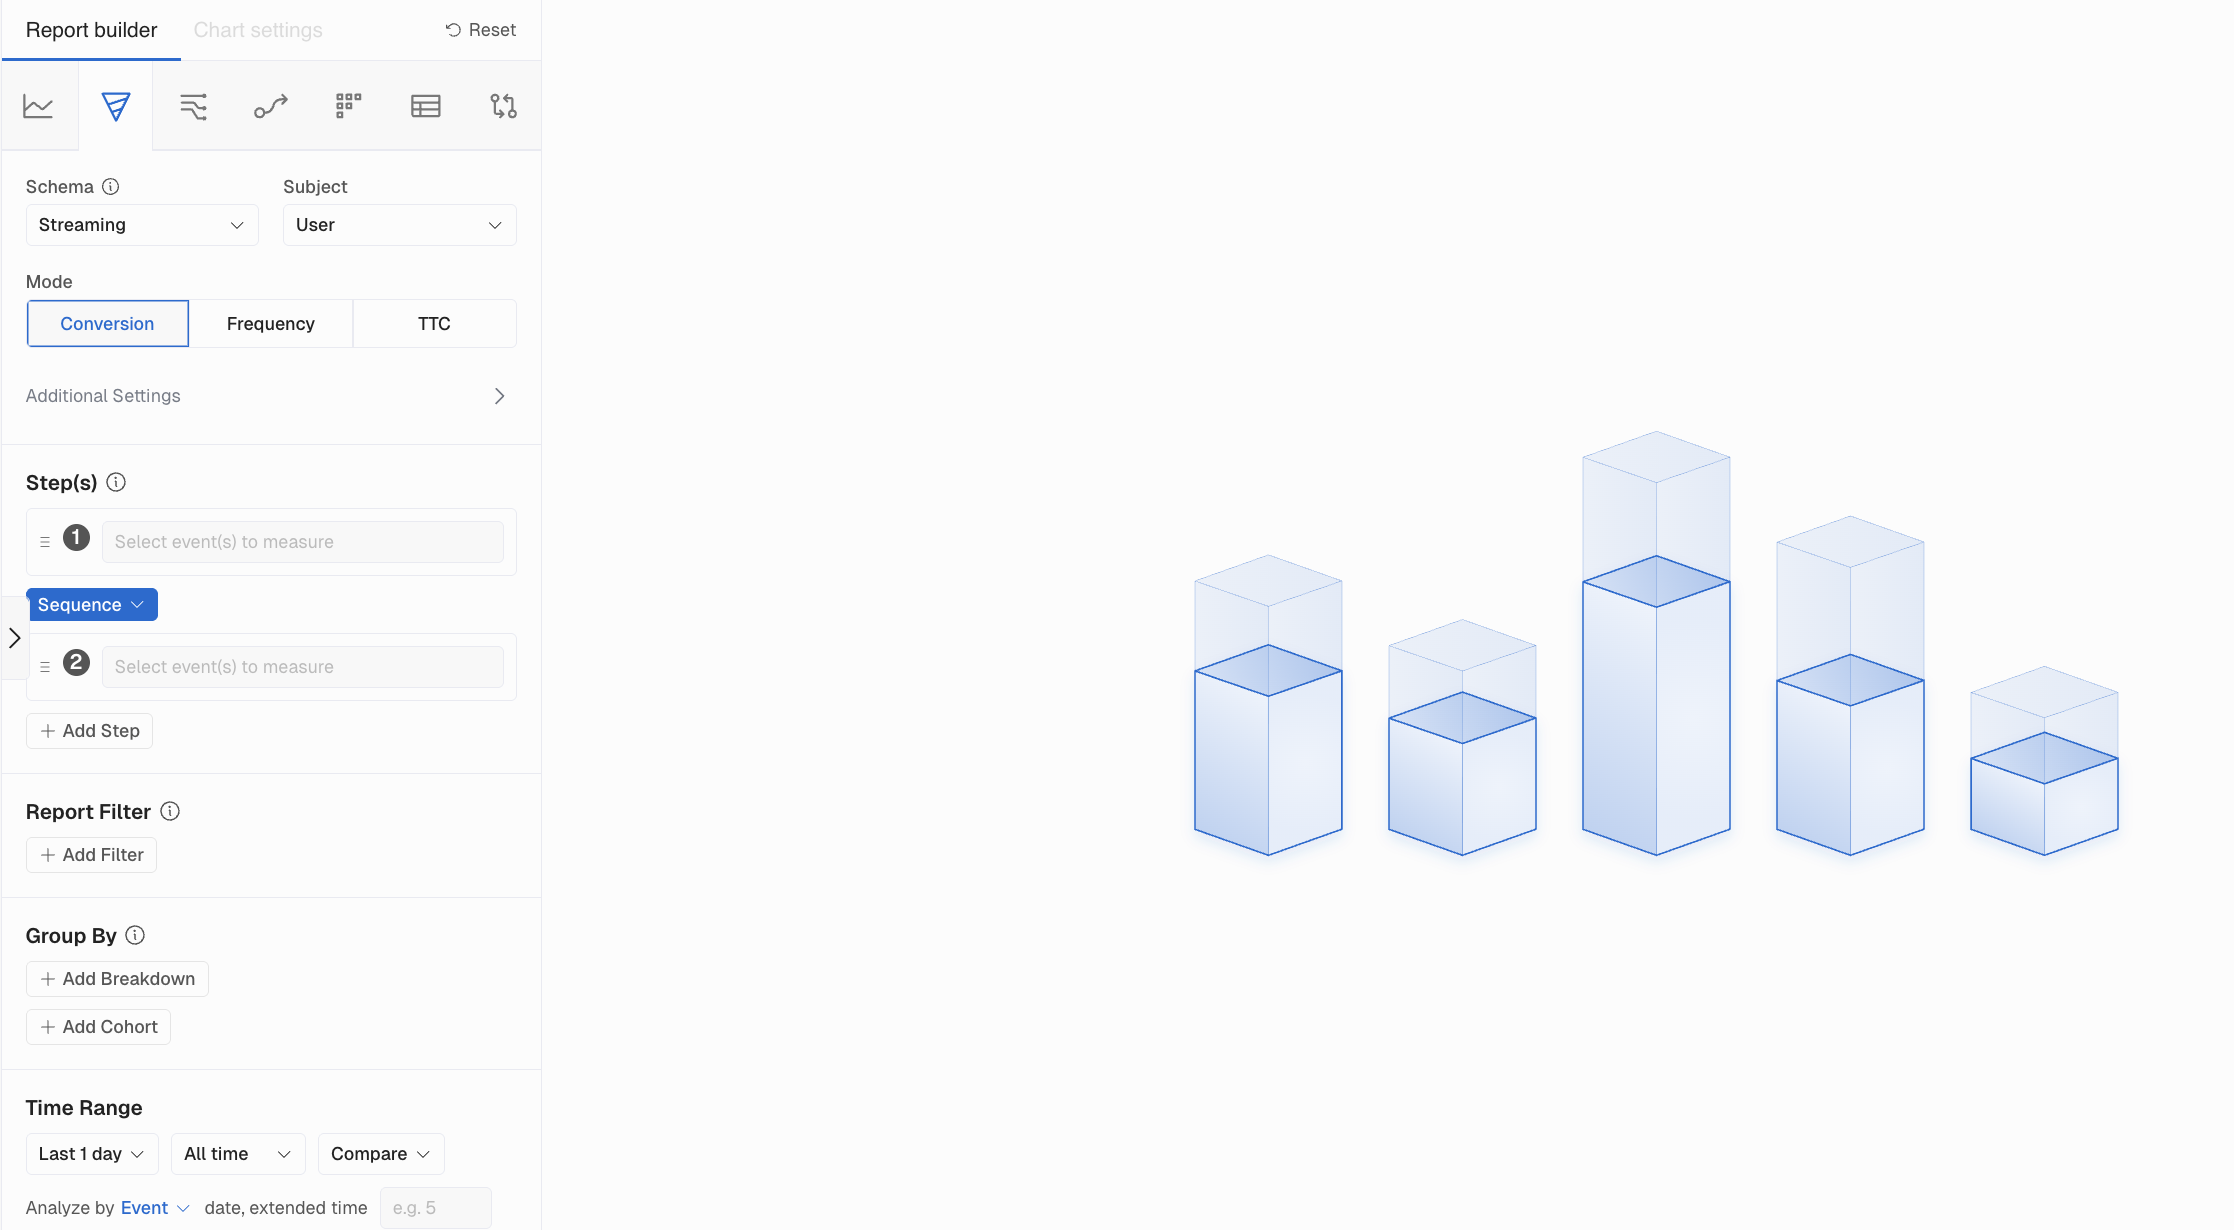
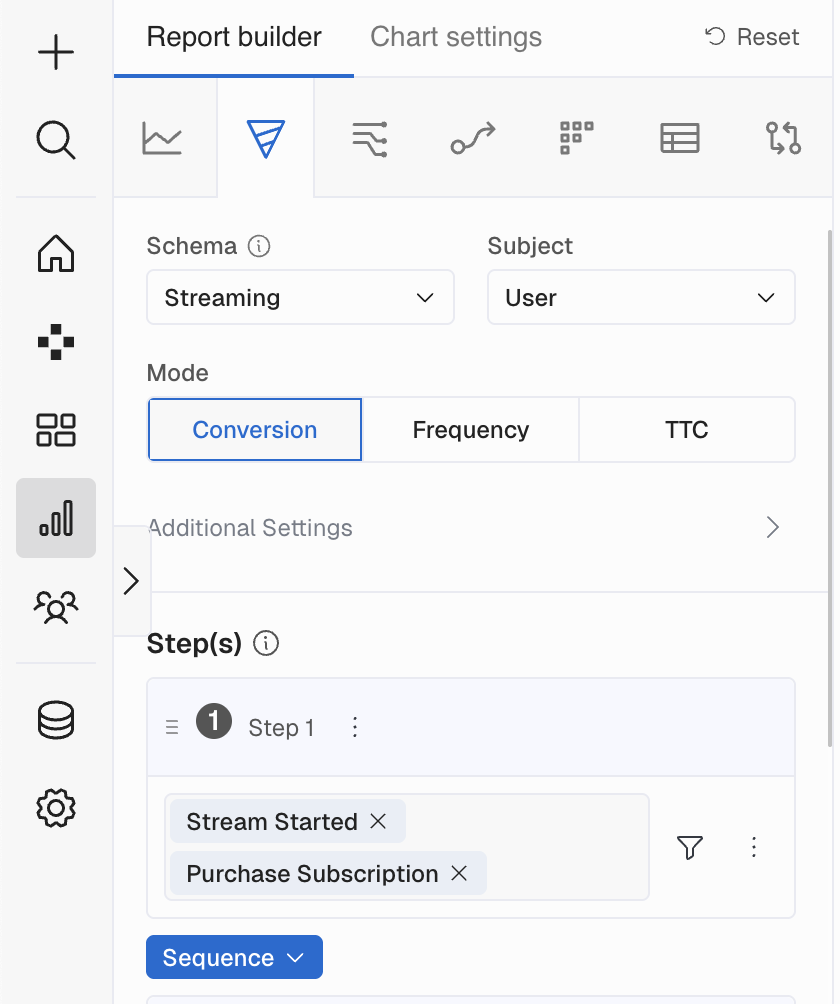
Main Funnel Controls
Funnel Steps
In Kubit you can add up to 10 steps in a Funnel. You can define multiple events and filters for each step (up to 5 filters).
Subject
Select the Subject. We provide you the option of analyzing by User or other Subjects within your Kubit instance. This is dependent on what Subjects are available.
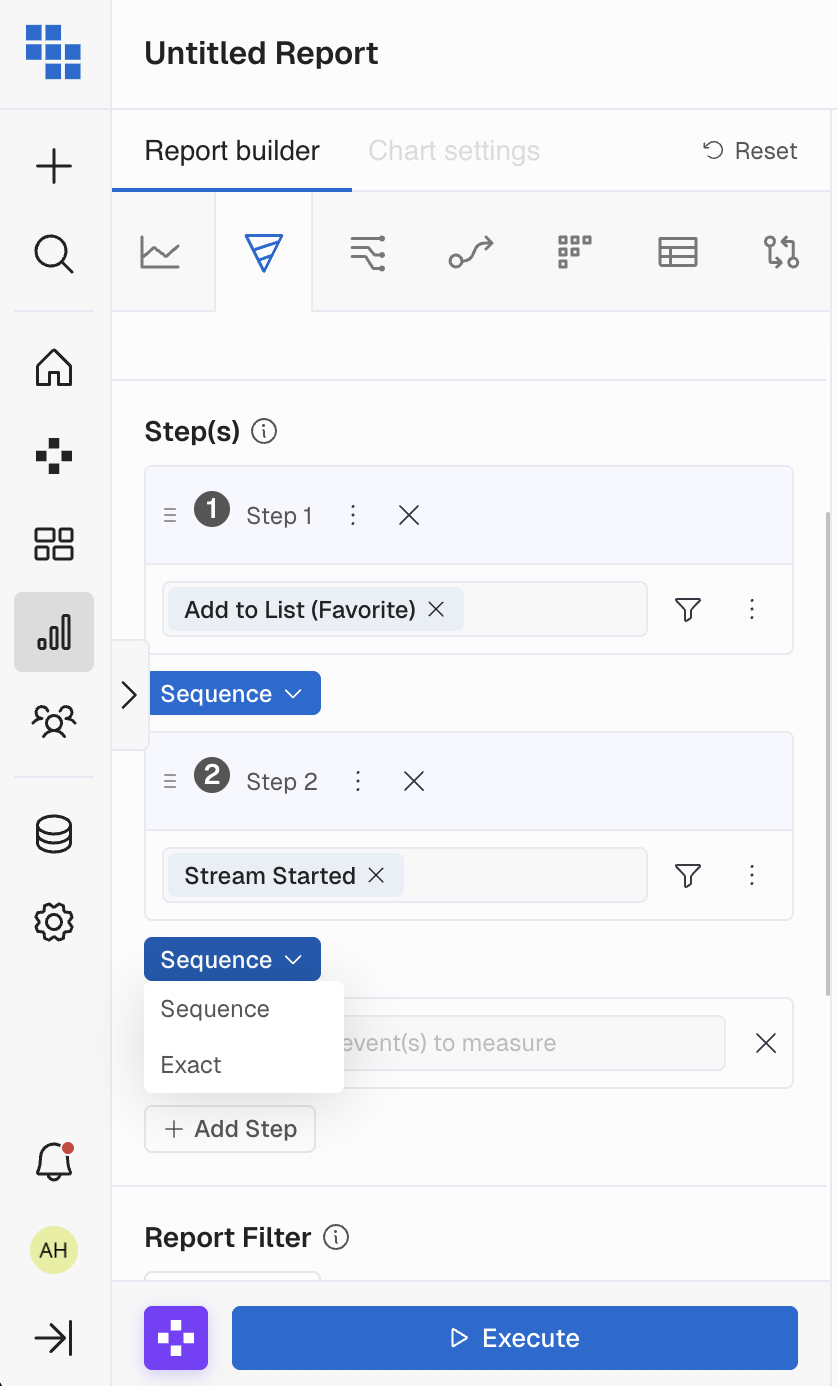
Order
To control the order your Funnel Steps occur we have four order options available.
Let's look at a simple example of possible steps in a Funnel:
| Example Funnel Steps |
|---|
| Log In |
| Search |
| Check out |
| Leave Review |
Immediately below is a summary of each of the options for ordering of events.
Sequence Order
Sequence order is the default order.
Using this will show a conversion based on when they happen sequentially, though there could be other events in between.
If we built our Funnel like this and asked "What is the Conversion Rate from Log In to Check Out but they performed a Search in between?"
| A Funnel With Sequence Order | Event | Event Timestamp |
|---|---|---|
| Step 1 | Log In | 1/1/2024 10:00am |
| Step 2 | Search | 1/1/2024 11:00am |
| Step 3 | Check out | 1/1/2024 4:00pm |
Sequence of the events to reach conversionThe result would be that a user had to perform Log In then perform Search then Check Out. If they did not perform a Search before Check Out they would not be counted as Converted.
Any Order
Using Any will show you a conversion rate based on the user doing Step 1 first and then doing any other event in Any order as long as it occurred after the first.
If we built our Funnel like this and asked "What is the Conversion Rate from Log In to Check out?"
| A Funnel With Any Order | Event | Event Timestamp |
|---|---|---|
| Step 1 | Log In | 1/1/2024 10:00am |
| Step 2 | Search | 1/1/2024 5:00pm |
| Step 3 | Check out | 1/1/2024 4:00pm |
Any Order is flexible on how conversion is reachedThe result would be that a user could have Check out then Searched or Searched then Checked out and the Conversion Rate would be the same.
Exact Order
Using Exact means the user had to perform events in that exact order without any other events in between. This is different from Sequence as that Order DOES allow events to happen in between.
If we built our Funnel like this and asked "What is the Conversion Rate from Log In, Search, Check out where the user did nothing else in between?"
| A Funnel With Any Order | Event | Event Timestamp |
|---|---|---|
| Step 1 | Log In | 1/1/2024 10:00am |
| Step 2 | Search | 1/1/2024 10:01am |
| Step 3 | Check out | 1/1/2024 10:02am |
Order of the events does matterThe result would be that a user must have done all 3 events in this exact order and nothing else in between. If a user Logs In then goes to Check Out without Searching they will not be counted as Converted.
Custom Order
Using Custom allows you to mix Sequence and Exact steps in Funnel. This is useful if a Funnel has some steps that can have events occur in between when others you want to have happen directly after the previous Step.
Precision of timestamp could impact resultsWhen many events have exactly the same timestamp there could be indeterministic results in Funnel and Path. Same formula will returns different results because the event order is not guaranteed from one execution to another.
Additional Setting Options
All additional settings can be found in the "Additional Settings" dropdown.
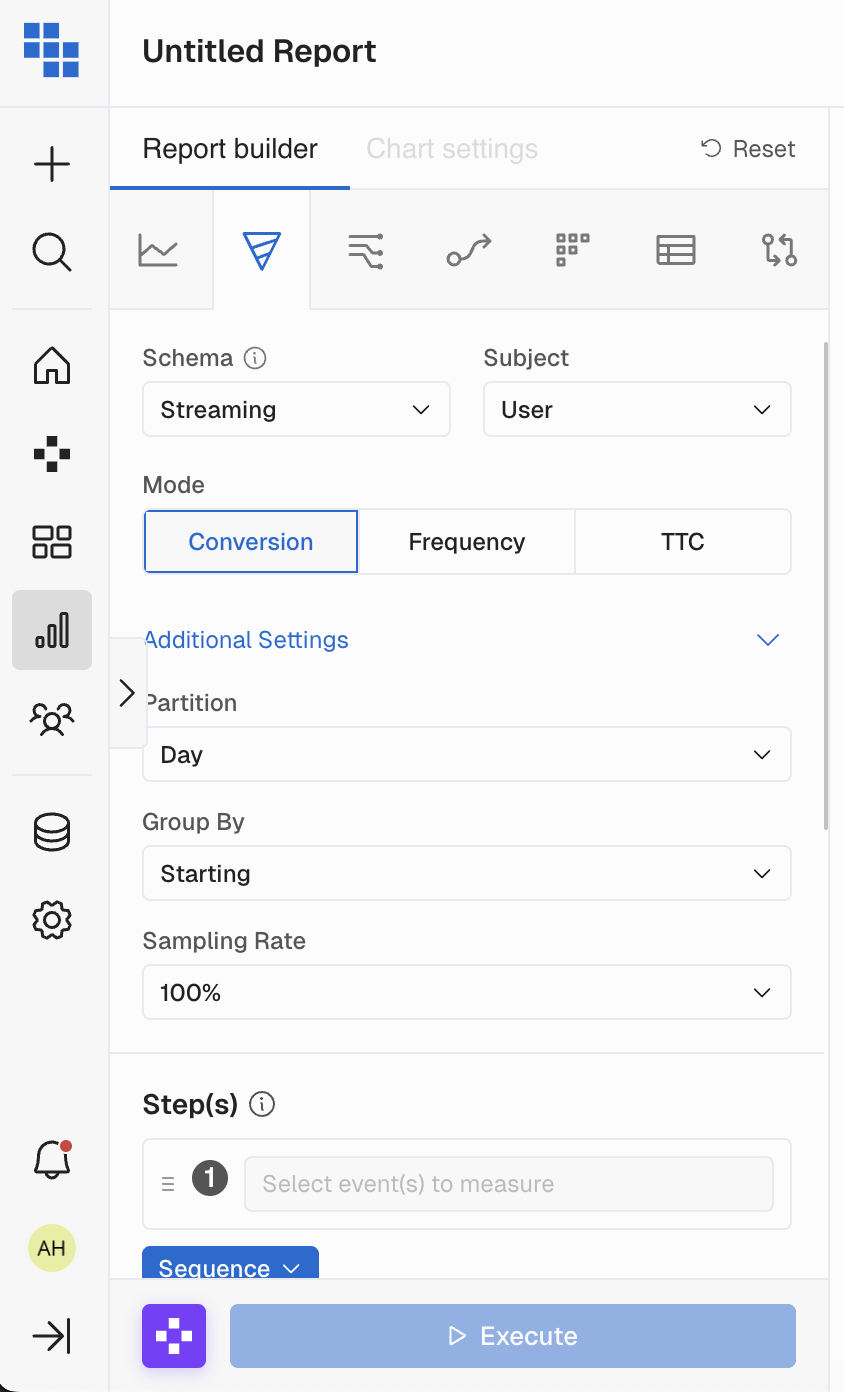
Mode
When looking at Funnels there is more than just the conversion rates. The Mode helps answer the following questions:
Conversion Mode
"What percentage of my users converted or dropped off"?
This mode is best to understand your overall conversion and see all members of the Funnel.
Frequency Mode
"How many times users performed an event before they converted to the next step"?
Best when you need to see the number of times something is performed before a user moves onto the next step.
Frequency Mode and converted usersIn Frequency Mode you are only analyzing converted users.
Time to Convert Mode
"How long does it take users to convert from one step to the next step(s)"?
Best when you want to understand the time it took to convert from Step 1-N and through the entire funnel.
Not sure of the Partition and Conversion Window?If you aren't sure of the correct Partition and Conversion Window, use Time to Convert Mode and see what the data tells you is they typical conversion window.
Time to Convert ModeIn Time to Convert Mode you are only analyzing Converted users.
Partition (Conversion Window)
The length of time you're giving a user to convert through the funnel
- Day: by default Partition the events by Day (all events have to happen within the same calendar day).
- Session(If applicable): for customers interested in
Sessionanalysis we can supply an additional option to tell Funnel that all steps have to happen within the same session. - None: this is useful when analyzing longer-term customer behavioral patterns.
- For example, any Subscription business would be interested in conversions from
TrialtoSubscriptiontoRenewaland try to understand what makes users subscribe and then stay.
- For example, any Subscription business would be interested in conversions from
- Conversion Window: all the funnel steps have to happen within the same time period defined by the Conversion Window.
- Supported Time Units for the window are:
- Seconds/Minutes/Hours/Days/Weeks/Months/Years.
- Conversion Window can be used in combination with partitions
DayorNone
- Supported Time Units for the window are:
Group by
When a Breakdown is used it can be important to understand attribution of conversion in a funnel. We offer two ways to analyze this in Funnels.
- Starting: breakdown applied over the first step, subsequent steps do not have to fall within the same breakdown group.
- Global: all the steps have to happen within the same breakdown group.
An example use case would be "What Campaign is driving the highest conversion to paid?" You will create the funnel with a Breakdown by "UTM Campaign" and set the Group by to "Starting".
Sampling Rate
Select a rate at which you want to sample the results to improve report performance if the data set is large.
Options Within Each Funnel Step
Filter Each Step
Once you've selected your Event for each step of the funnel you can apply filters to each step individually to ensure you are capturing the correct conditions.
Exclude Events Between Steps
Between Step 1 and 2, or 2 and 3 etc. there may be instances where you only want to count a conversion if a user did NOT perform an event in-between. We allow this by clicking "Step Options" and selecting "Exclude Events".
Examples could include:
- Show me conversion from Step 1 to Step 2 for all users who did not register.
- Show me conversion from Step 3 to Step 4 for all users who did not end their session.
Add Conversion Window Between Steps
There may be cases when you want to set a custom conversion windows between Step 2 and 3, or 3 and 4 etc. We allow this by clicking on "More Options" and selecting "Conversion Window"
Supported Time Units for the window are: Seconds/Minutes/Hours/Days/Weeks/Months/Years
Add Additional Events Within A Step
When building a funnel multiple events within a single step could be considered a true Conversion. In Kubit you are able to achieve this in two ways:
- Add additional events within the same Event module to perform an OR statement. All filters applied will be included for each event
- Add additional events with
More Actionsicon on the far right side of the Step. This allows for the same OR condition but you're able to apply filters to each event independently.
Re-Order Steps Using Drag and Drop
When building a funnel you may need to re-order steps when using a "Sequence" or "Exact" Order. In Kubit you're able to drag and drop steps and re-order them as needed.
Create a Cohort from Funnel Results
Once you've constructed your funnel and reviewed the results it's common to want to isolate users who converted or dropped off at a certain point for further analysis.
To create a Cohort from a Funnel you will right-click on the step of the funnel and select "Create Cohort" or select the Measure step from the context menu.
Once the Cohort is created you will see the selected parameters and steps in the Cohort definition. Feel free to customize or edit further and Save.
Funnel Chart Controls
Compare conversion rate between multiple breakdown groups
If you want to compare the conversion rate between multiple groups along a period of time you are able to select the most important breakdown groups and see them side by side as well as hide ones that aren't as valuable. Also comparing against Overall is a great way to measure improvements over baselines.
Show Additional Conversion Metrics
In Funnel you are also able to expose additional Conversion Metrics settings like Bounce Rate.
- Relative Conversion (Kubit Default): Calculate the conversion rate based on the % of Subjects that completed the previous Step and carried on to the next.
- This means the denominator will always be the converted population from the previous step.
- Absolution Conversion: Calculate the conversion rate where the denominator does not change and is always the number of Subjects that began the funnel.
- Bounce Rate: The inverse of Conversion, the % of Subjects that did NOT continue to the next step of the Funnel.
Updated 6 months ago
What’s Next
See more tips about using the funnel on our Funnel Tips and Tricks page.