Incidents
Place additional context alongside your reports with Incidents in Kubit.
An Incident in Kubit is a defined date or time period that a material business or product related event occurred that could impact the data the user is analyzing.
Incident Types
In Kubit we allow you to create these Incidents inside our UI and provide the following types:
| Incident | Use Case Examples |
|---|---|
| Holiday | Highlight holiday seasons or periods that may explain data changes |
| Release | Note Releases to track adoption or major changes in metrics pre & post release |
| Operations | Note data tracking changes, mistakes or gaps in tracking to explain low counts/KPIs |
| User Acquisition | Call out major acquisition campaigns or events |
| Marketing | Note Marketing efforts or large campaigns |
| Outages | Document major service outages or data outages that can cause gaps in data |
| Other | Any other type that you'd like to document in Kubit |
You're also able to Create a Custom incident type to better align to your organization.
Create Custom Incident Type
While Kubit has out of the box Incident Types you're also able to create custom ones for your organization.
The process to create a custom incident type is:
- Left click on a data point in a Kubit report and select "Create Incident"
- In the Incident Type dropdown, click and enter the name of your new Incident Type
- You will see text that says "Create custom incident type:"
- Click the new Incident Type you've created from the dropdown
- Complete filling out the remainder of the form to create the incident
This can also be done from the "+ Create Incident" button on the Incidents screen.
Create an Incident
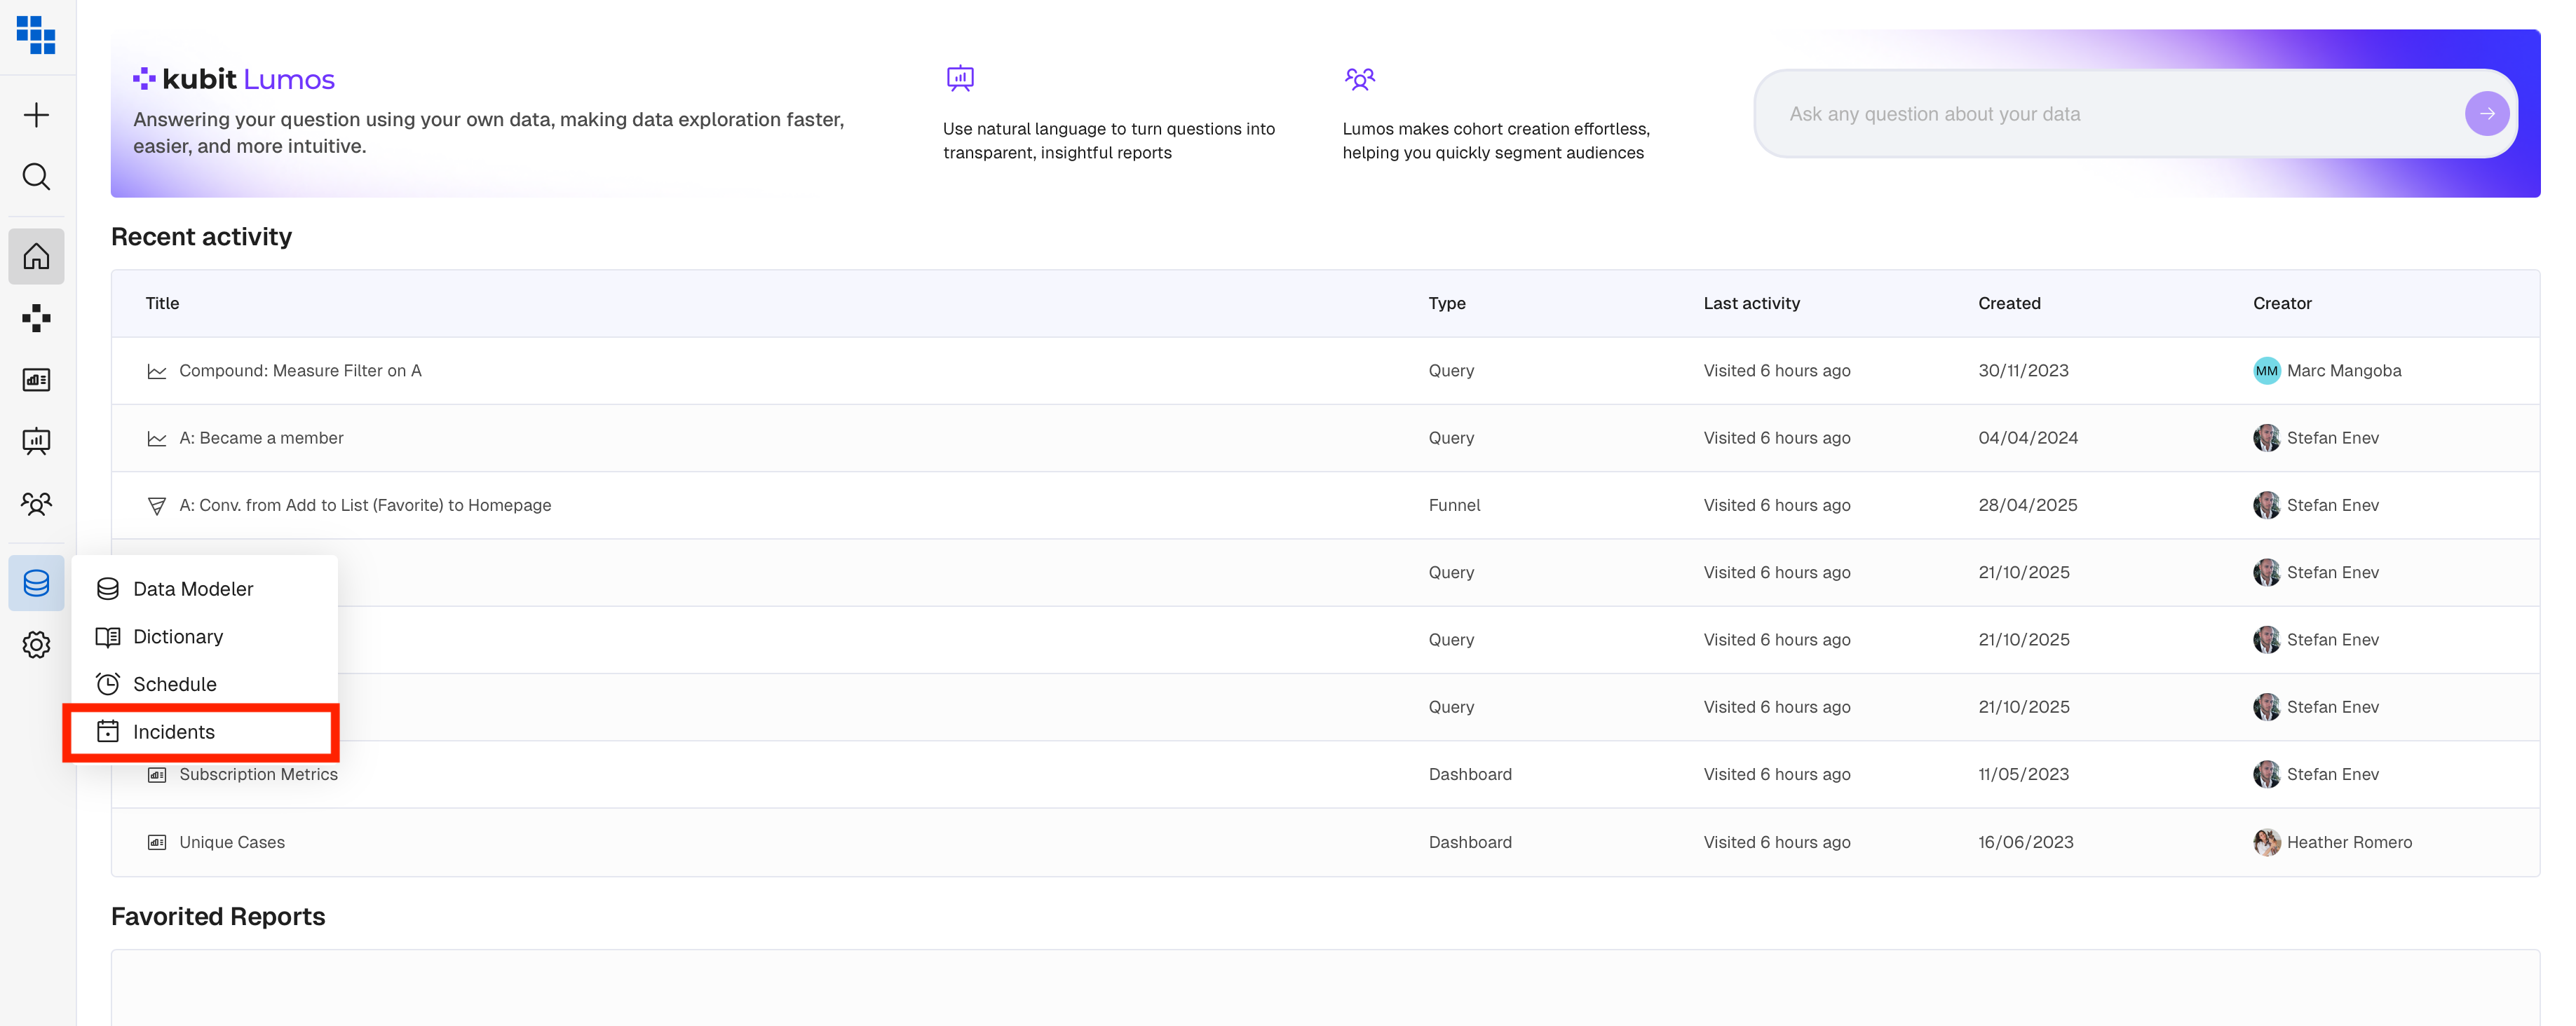
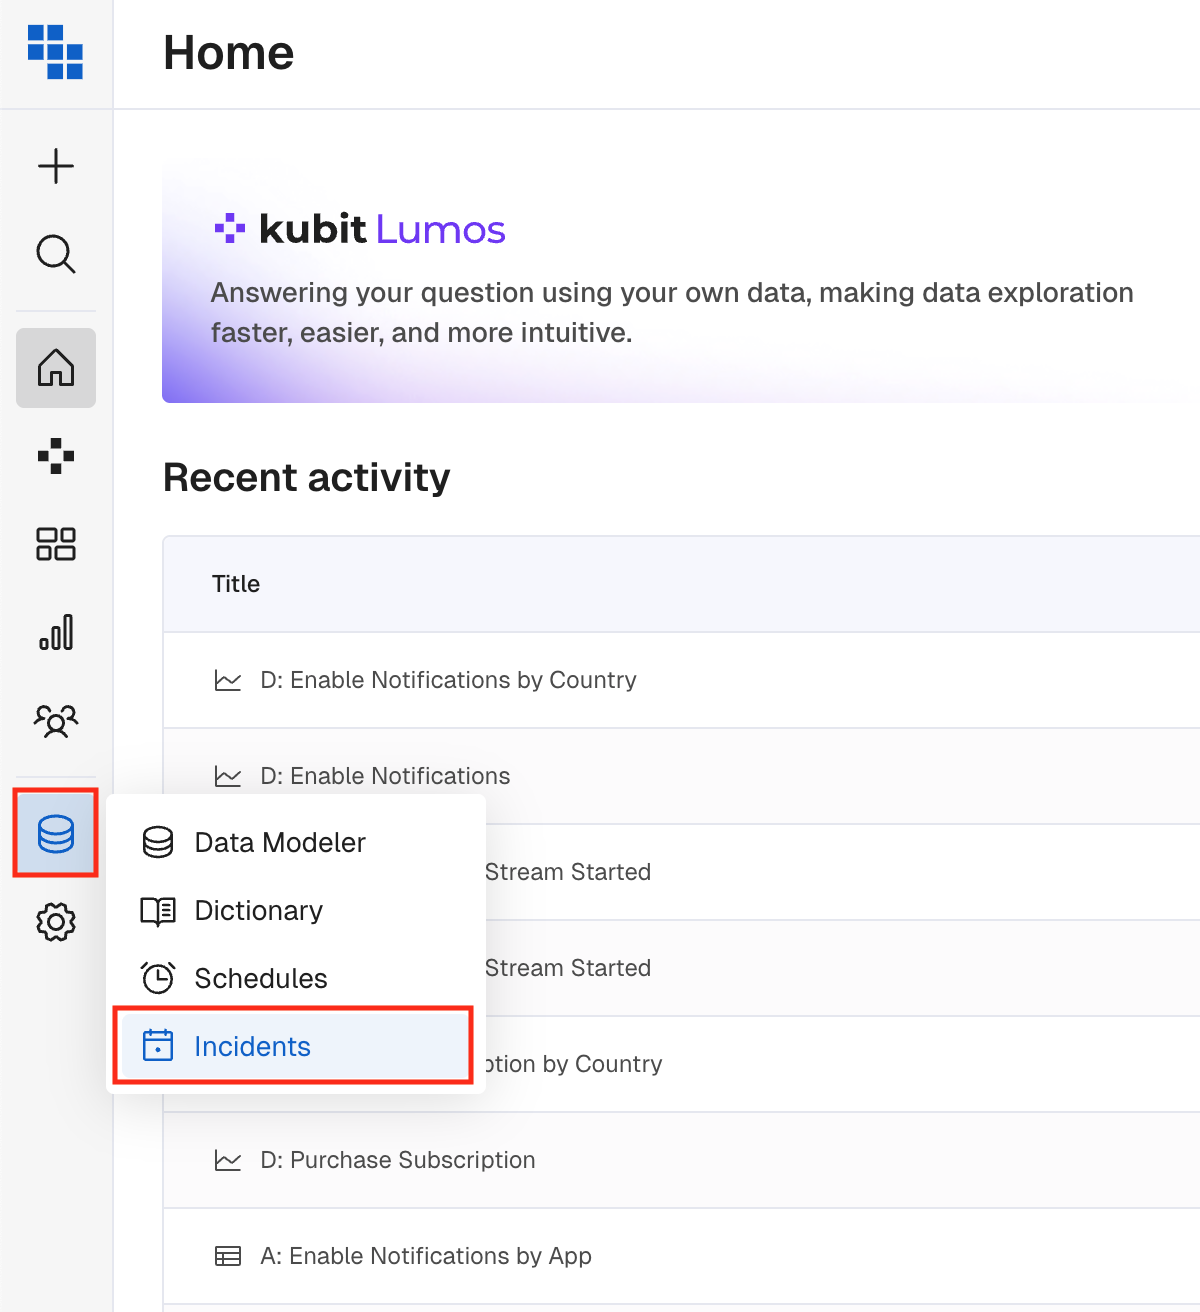
To create a new Incident in Kubit navigate to the Incidents tab and either:
- Click the Data Management icon in the top navigation and select Incident.
- Click the "Create Incident" button in the upper right corner and add all the details of your Incident.
- Click Create and it will now appear on relevant reports for that time frame.
You can also create an Incident directly on a Report in Kubit.
- Left click on the date you want to create the incident for
- Click "Create Incident" from the pop out menu
- Enter the details of your Incident and adjust the timeframe if needed
- Reload the page and now the incident will appear when you toggle on "Incidents" in the report settings.
- Input the necessary information to the Incident and click "Create".
How to Manage Incidents
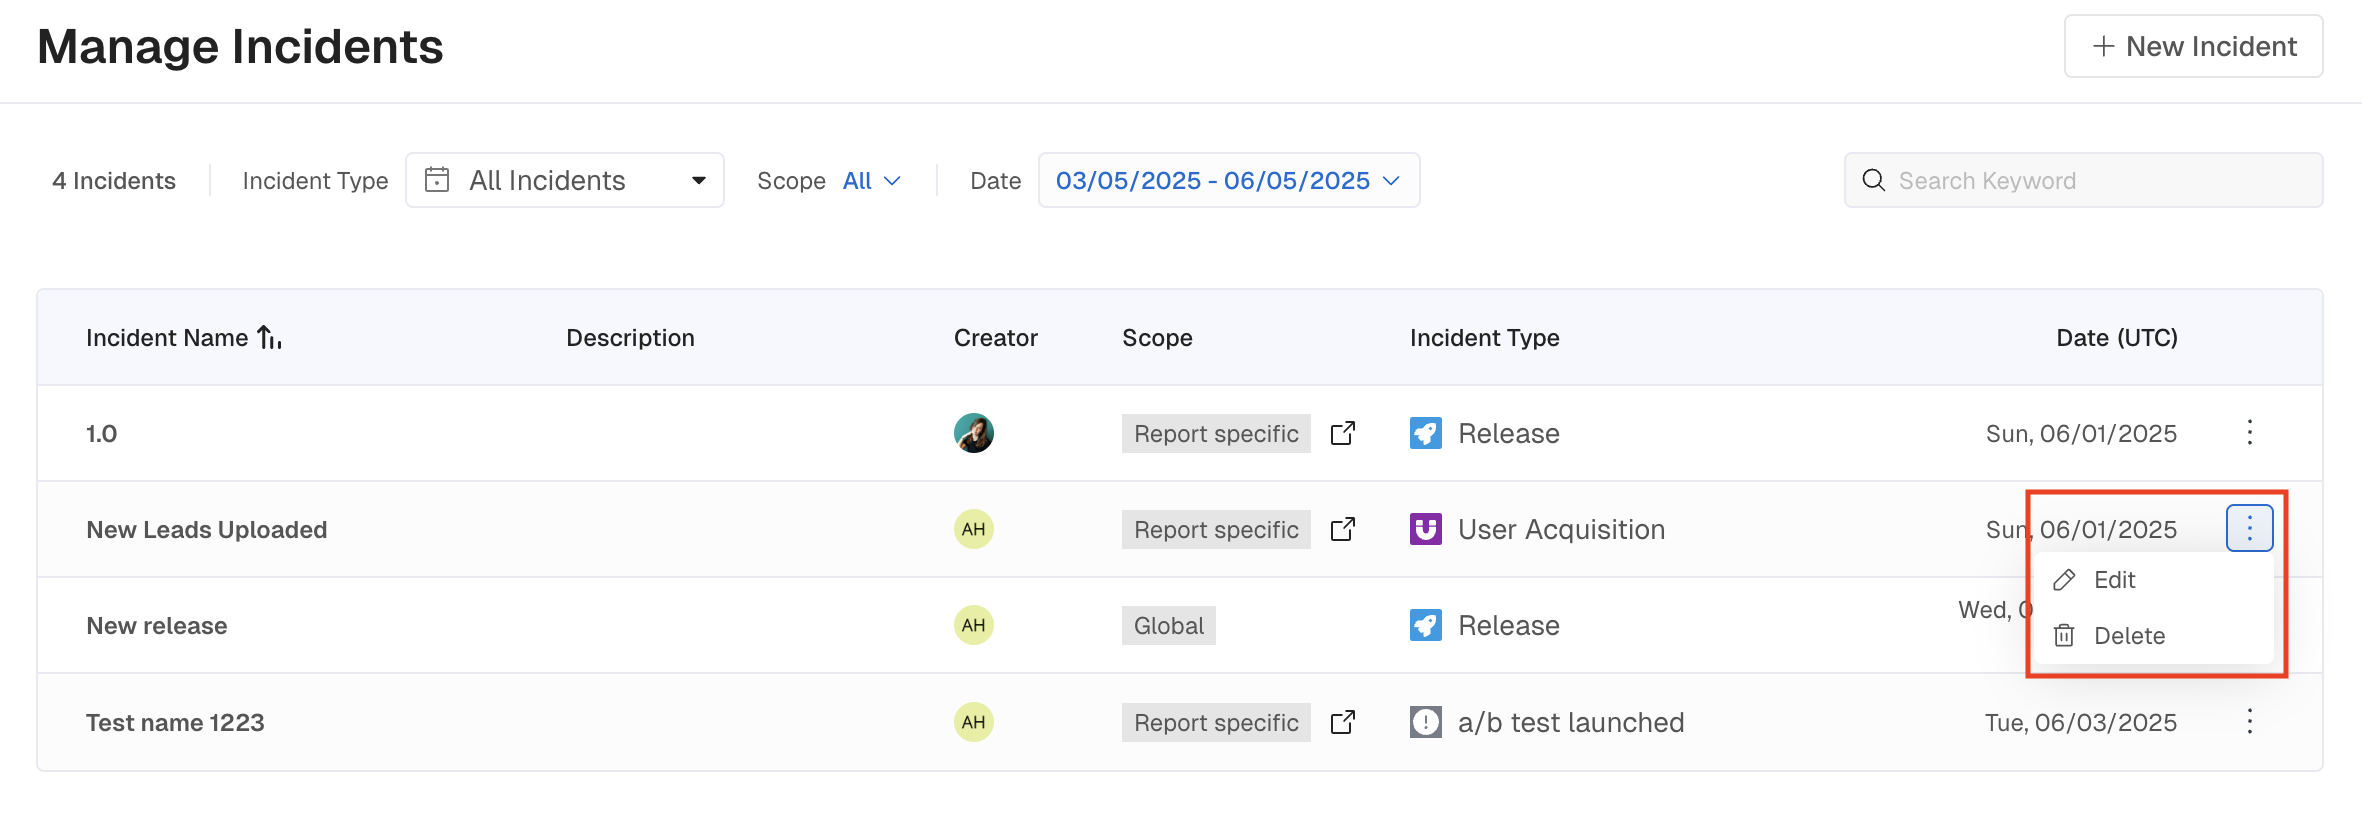
Once Incidents have been created you will see a list of them in the Manage Incidents page. From here you can search the list using Keywords or date ranges.
Clicking on the three vertical dots to the right of an Incident will let you Edit or Delete it.
Seeing Incidents on Reports
Once an Incident is created end users are able to view them in context of their analysis as needed.
Once a report has been generated click the vertical three dots in the upper right corner of the chart and select Incident. Toggle on and off the Incidents you want to see that occurred during the reports time range.
Clicking on an Incident will show the details of it within the chart.

Updated 6 months ago