Breakdown of Results
Also known as Slice and Dice or Group By
Introduction
Breakdown is a powerful tool that helps you gain insight into how to optimize your product development and marketing efforts. In Kubit, you can use Breakdown to analyze your dataset by user behaviors and attributes.
Here are a few examples to illustrate how to leverage the Breakdown feature
- By behavior - (Example) Gauge the impact of different marketing campaigns on user conversion rates.
- By attribute - (Example) Assess user engagement by age group.
- By attribute & behavior - (Example) Determine the effect of A/B testing on users who live in cities (an attribute) and have logged in at least five times (a behavior).
Create a Breakdown by Field
The most straightforward breakdown is by field. Examples of fields include Age Bucket, Country, and Device Family. You can select a field by clicking on Breakdown, selecting the desired fields, and then clicking Confirm. You can select up to 2 fields, including nested properties, to group your dataset. When you execute the query, the chart displays your data grouped by the selected fields.
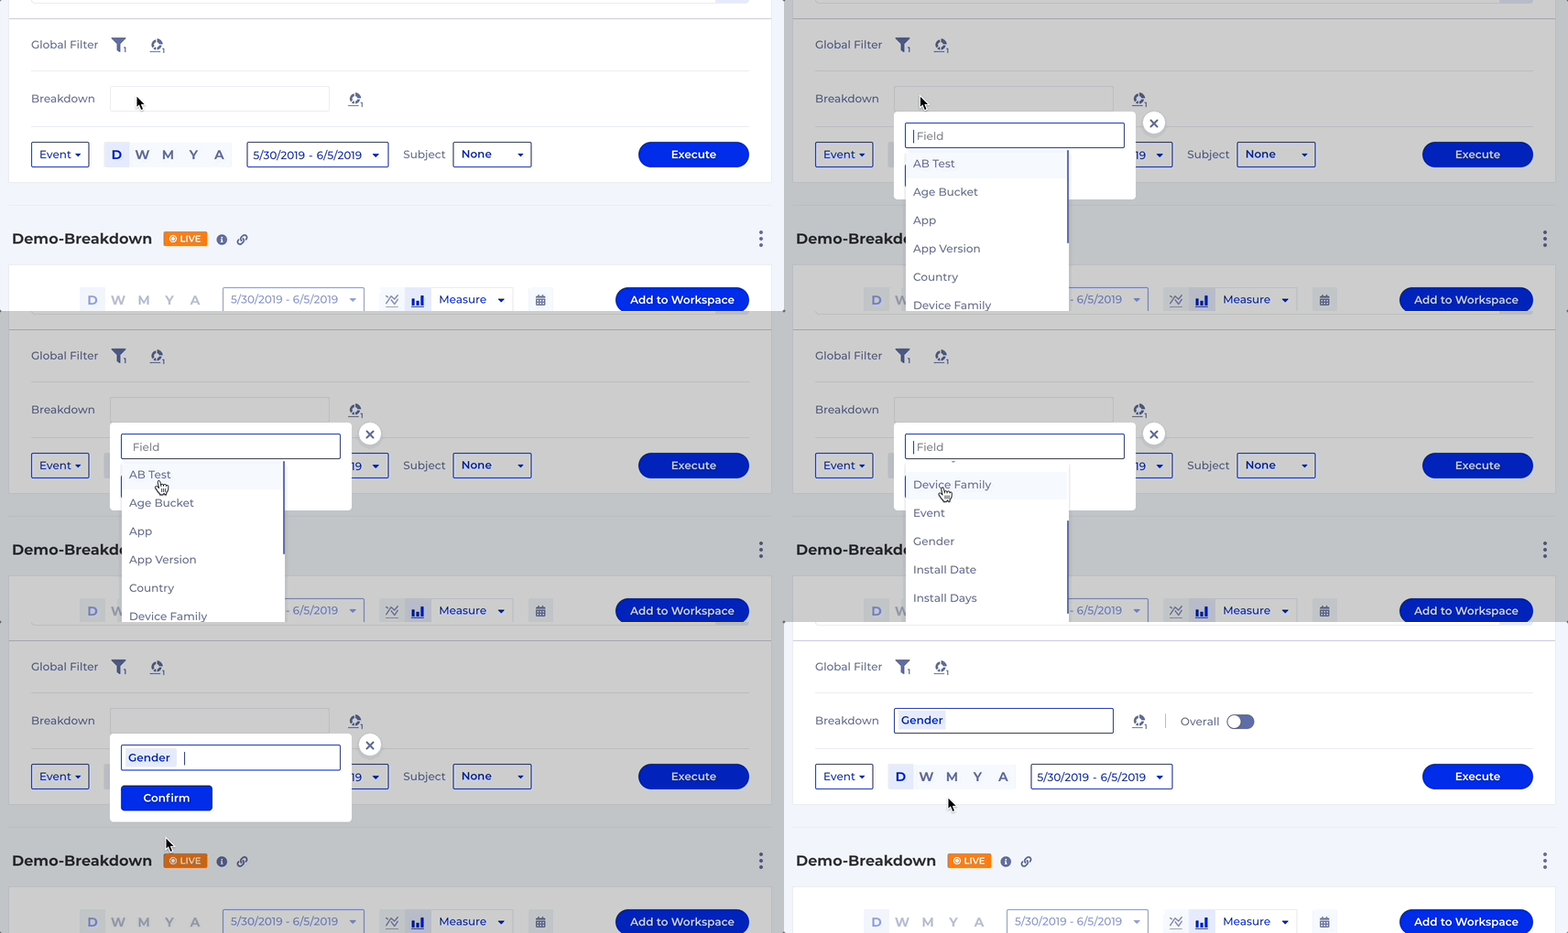
Overall Toggle Option
Next to the Breakdown input is a toggle switch labeled Overall. Toggle the switch to add or remove a measure that is the sum of the breakdown group measures.

Create a Breakdown by Cohort
Click the cohort icon to apply cohorts to your analysis. You can remove a cohort by clicking on the cohort icon. You can select up to 5 cohorts.

Kubit provides two options for applying cohorts - saved cohort or defined cohort.
Apply a Saved Cohort
Apply a saved cohort by clicking on the + option next to Cohort and then selecting a cohort.

Apply a Defined Cohort
The other method to apply a cohort is to define a cohort. To apply a designed cohort, click on the + option next to Cohort and then use the options to design your cohort. You can save your new cohort using Save Cohort.

How Results are Sorted When Breakdown is Used
The user interface limits the number of measures displayed on the chart (e.g., screen size, orientation). As a result, Kubit sorts the results to show the most valuable results at the top. Kubit defines valuable in terms of meaningful, deterministic results and meeting expectations. Kubit users vary on how to weigh these factors, so it is essential to understand how the Kubit sorting algorithm works so you can customize the analysis to meet your needs.
Kubit sorts results according to the type of analysis performed (i.e., Query, Funnel, Retention). An outline of how Kubit sorts results is detailed below.
Query - How Results are Sorted
In the Query analysis, the default measure is the result measure specified in the Query. Kubit sorts the results in descending order.
Let's look at an example to illustrate.
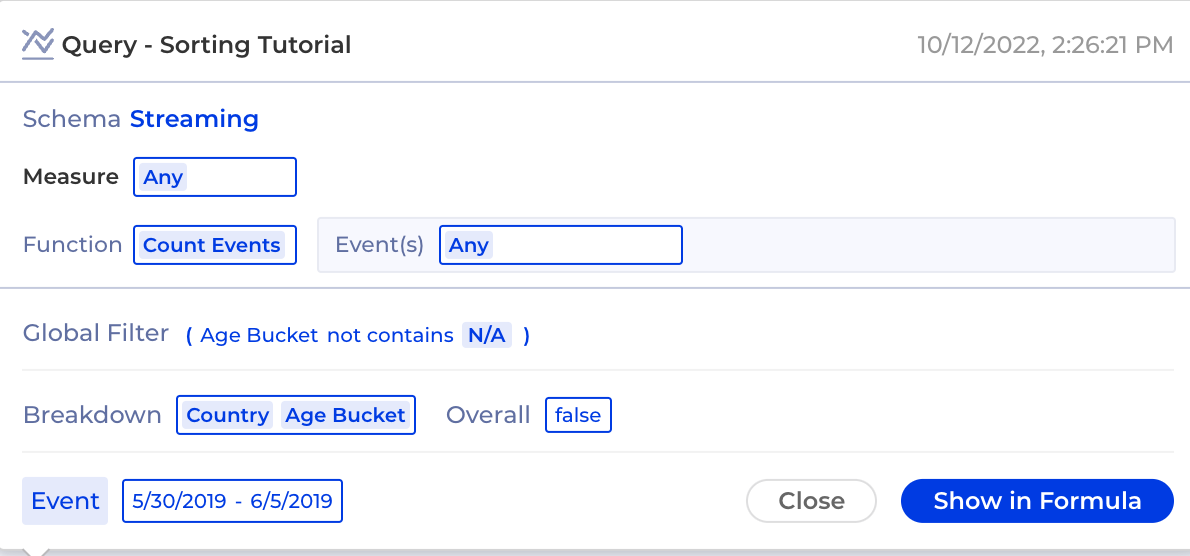
In this example, the result measure is the number of events. And measures are grouped by Country and Age Bracket. Notice from the chart that group "RU-26-35" is in the fourth position despite having low measure values until 6/3/2019. Why is that?

Let's take a look at the underlying dataset for answers. Below are the results as sorted by the sum of the measures. Notice that the measure for "RU-26-35" increases significantly on 6/3/2019, resulting in that group's position.

Funnel - How Results are Sorted
In the Funnel analysis, the sorts depend on the partition type. Kubit uses two sorting algorithms, as described below.
-
Algorithm #1 - Sort by the measures in the first step of the funnel. This sorting algorithm gathers the measures of the groups in the first step and sorts the groups in descending order of the measure.
-
Algorithm #2 - Sort by the sum of measures in the first and second steps of the funnel. This sorting algorithm gathers the measures of the groups in the first and second steps and sorts the groups in descending order of the sum of measures.
Sorting algorithm #1 is applied when the selected partition is "Day." Sorting algorithm #2 is used for all other partition types (i.e., "None", "Conversion Window").
Retention - How Results are Sorted
In the Retention analysis, the default measure is the count of the initial cohort subject.
Let's look at an example to illustrate.
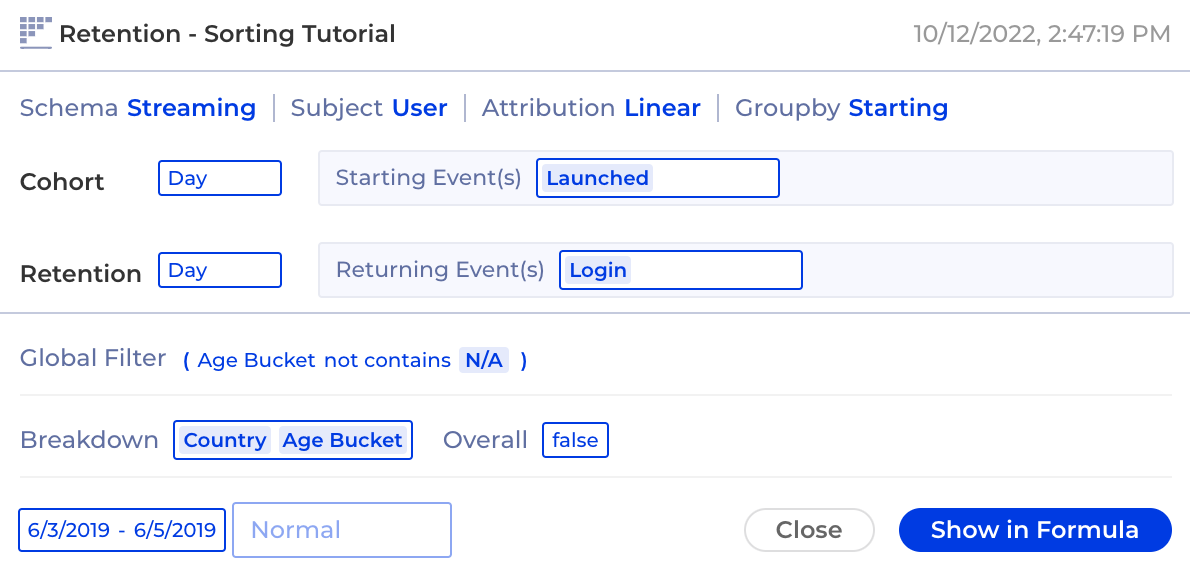
In this example, the measure is the count of users who performed at least one event tagged as "Launched." And measures are grouped by Country and Age Bracket. Notice from the chart that group "ID-26-35" is sorted before "US-36-25." Why is that?

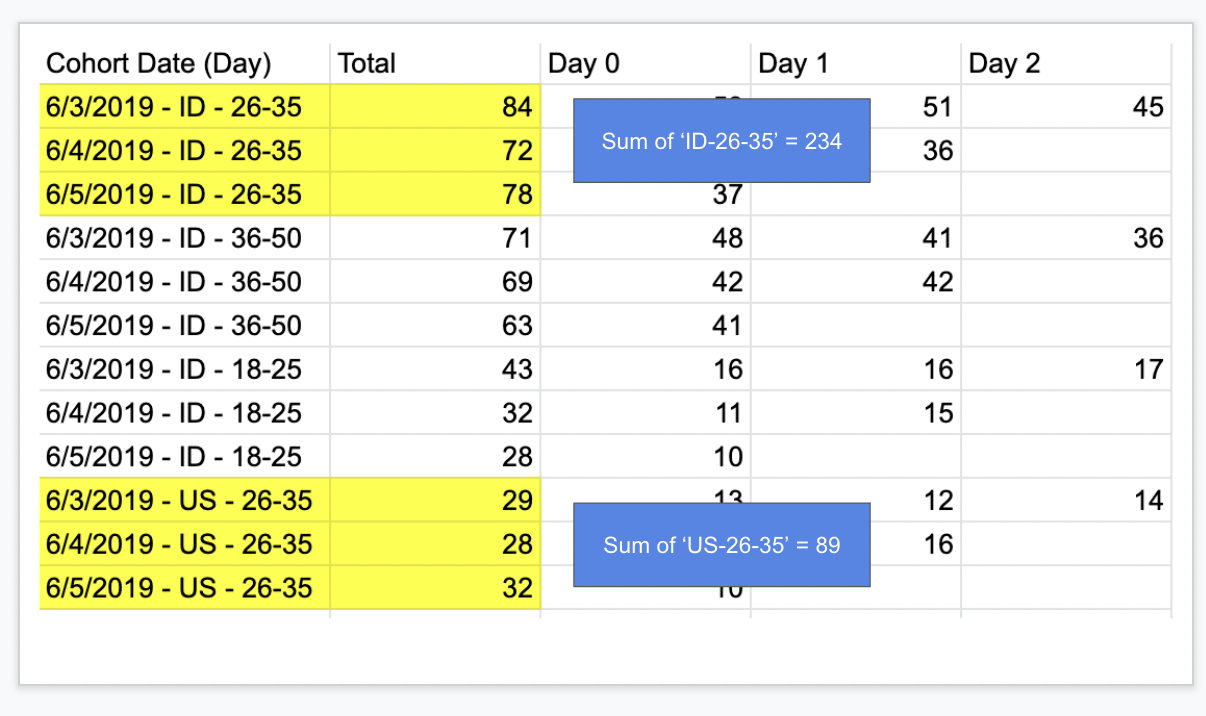
Let's take a look at the underlying dataset for answers. Below are the results as sorted by the sum of the measures in descending order. Notice that the sum of the measures for "ID" is higher than "US."
Sorting Options for Charts with a Breakdown
Sorting options are only available in bar charts created using the Query analysis. The sort option depends on the time units selected.
Sort Option - For All Time
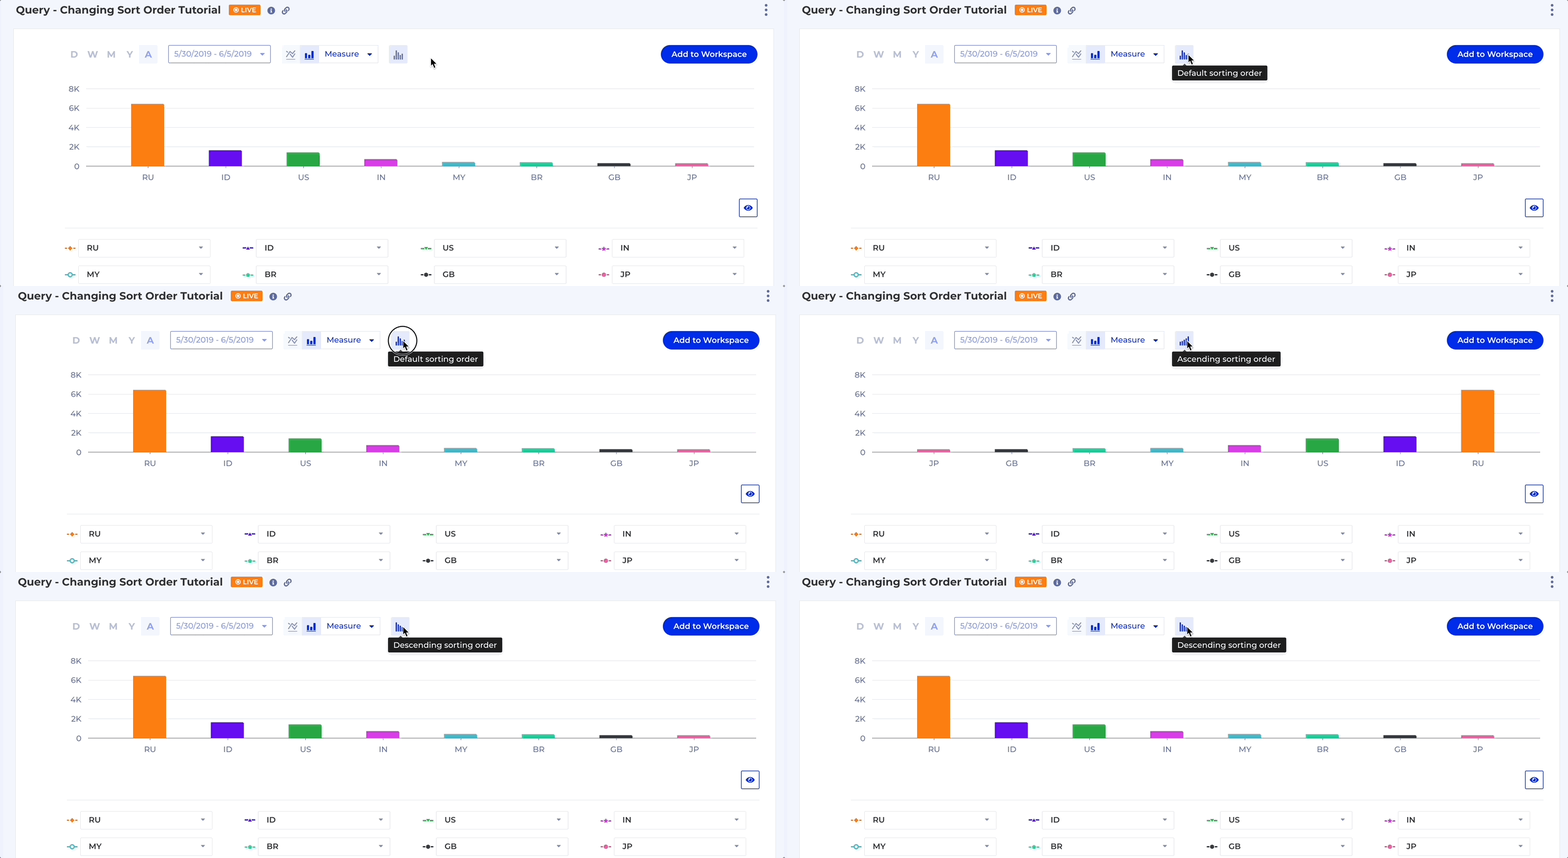
All TimeWhen All Time is selected, the sort icon will appear, enabling you to change the sort order. The default sort order is by measure. Click on the sort icon to change the sort order.
Sort Option - For All Other Time Units
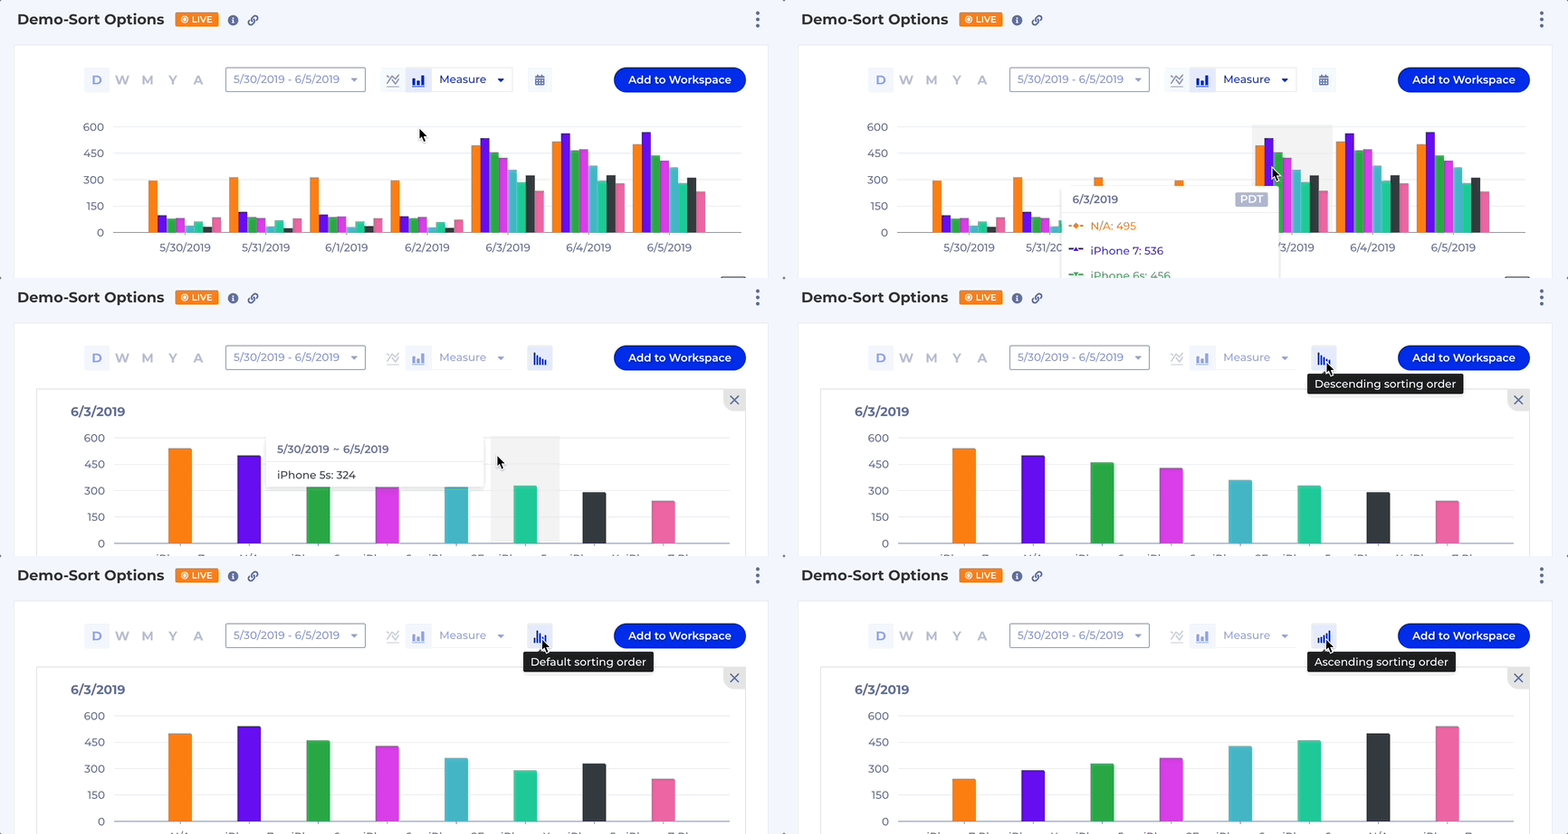
For all other time units (e.g., Day, Week, Month, Year), the default sort order of the horizontal axis is by time period with the most current time period on the right side of the chart. You can sort the data by drilling down into a specific time unit. In drill down, you hover over the time period of interest and click the right mouse button to display the Expand option. Click on Expand to access a detailed view of the dataset for one time period. You can change the sort order using the sort icon button.
Hide or Display 'Others' in Stacked Column, Percentage Area, and Pie Charts
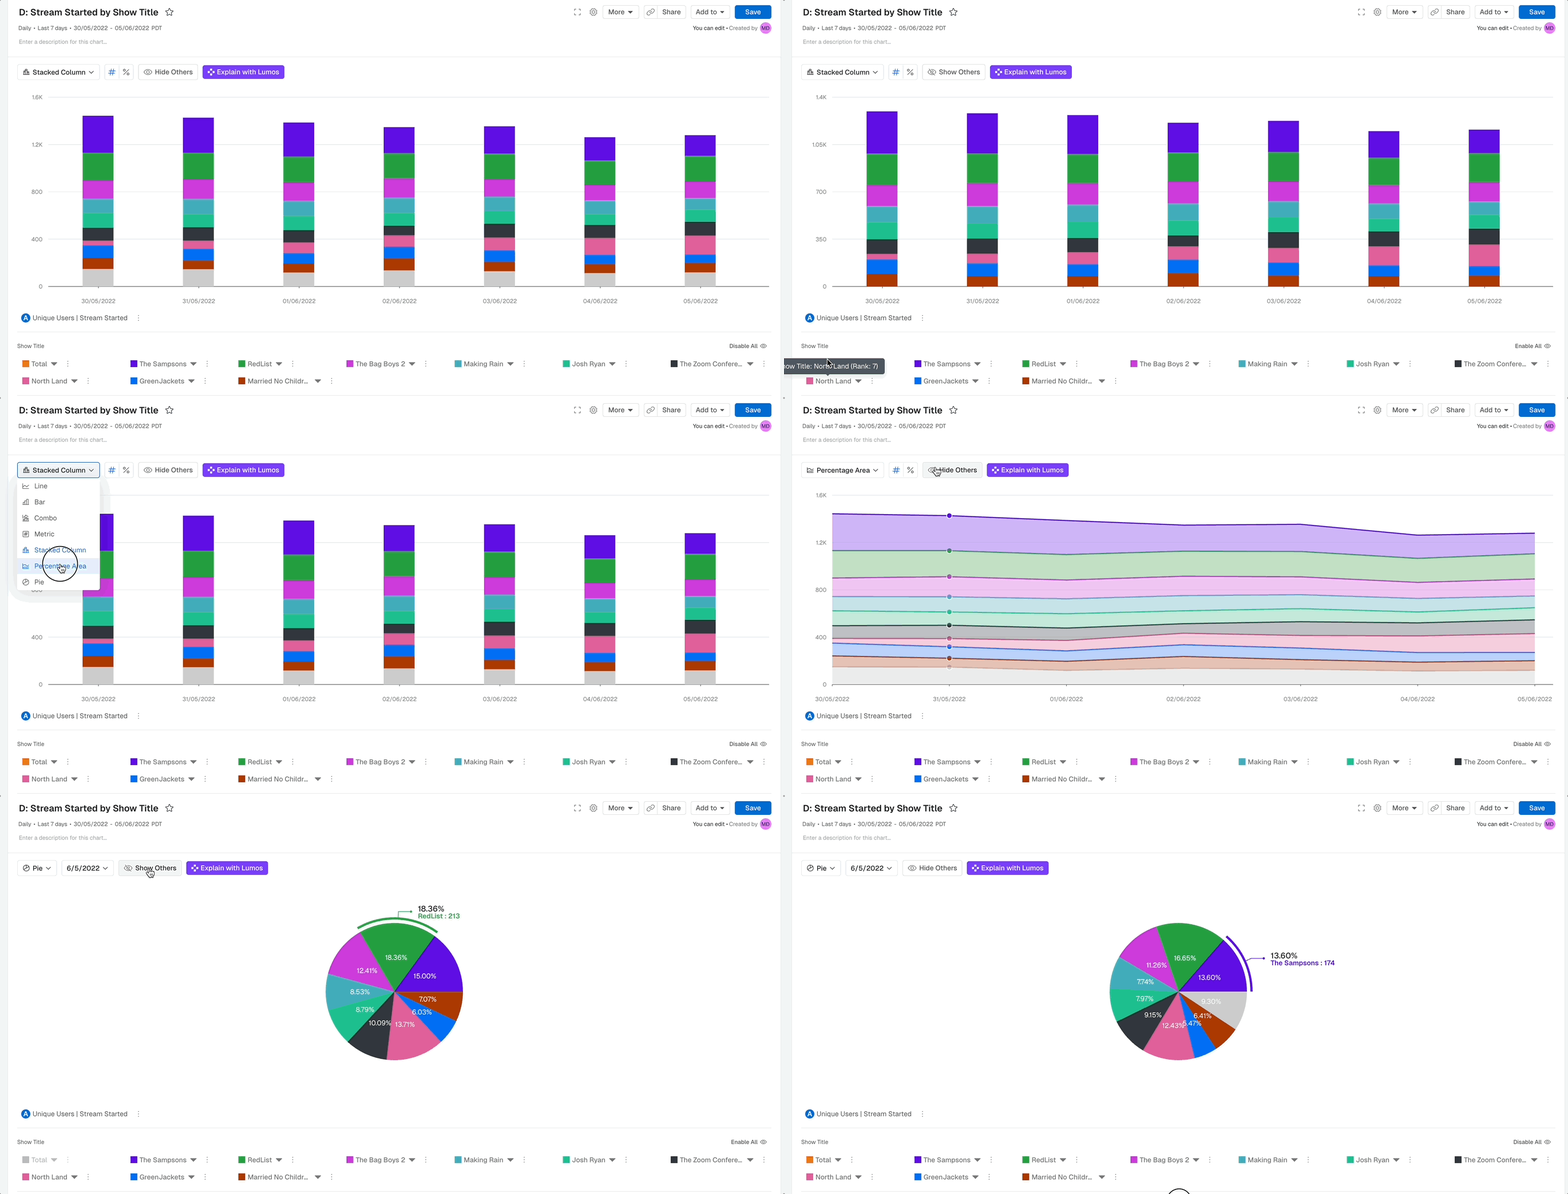
You can Hide or Display the 'Other' data results within Stacked Column, Percentage Area, and Pie Charts
Limits to the Number of Breakdown Groups Displayed on the Screen
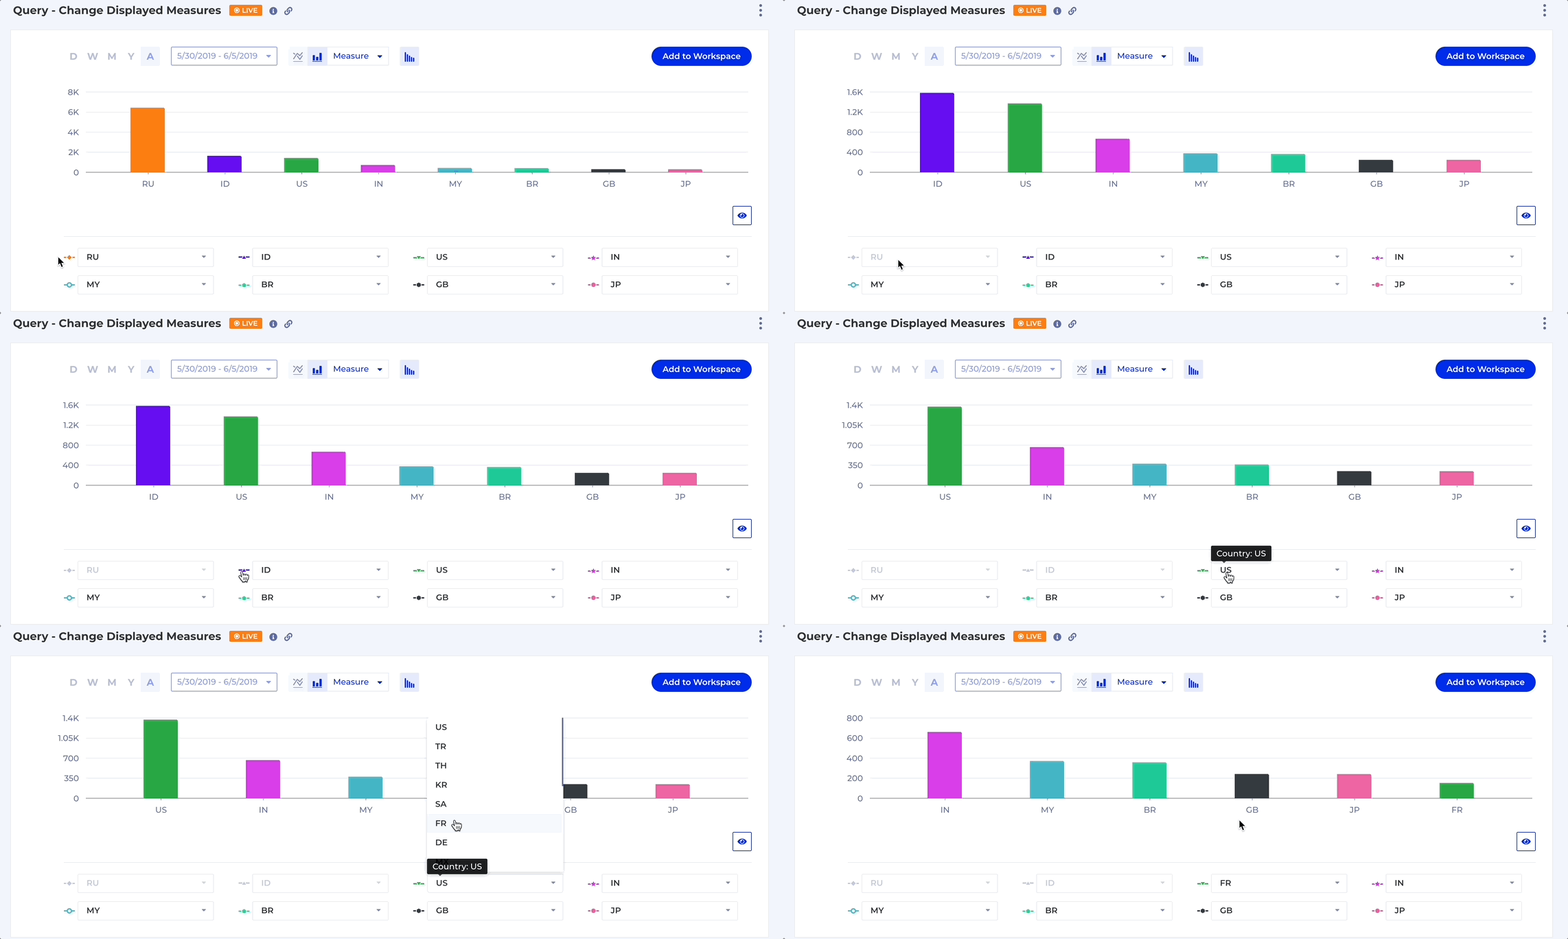
Kubit displays up to eight groups on a chart. You can modify the groups displayed by using the options at the bottom of the chart.
Limits to Exporting Datasets With a Breakdown
You can export data from Kubit using the Export to CSV option in the context menu. Note that exported datasets are limited to a maximum of 500 breakdown groups.
Updated 3 months ago