R302 - 2023-06-07
- Added Custom Binning
- Ability to easily exclude Events from Path
Added Custom Binning
What is Binning?
Data binning, or data bucketing is grouping the original data values which fall into a small interval into one new value - a bin. It has multiple applications:
- Define custom geographical regions with Binning
- Tune the ranges for a frequency distribution in histograms
- Compare the size of a few bins against each other and the total
- Correct instrumentation errors for the purposes of an analysis on the fly
Define a binning
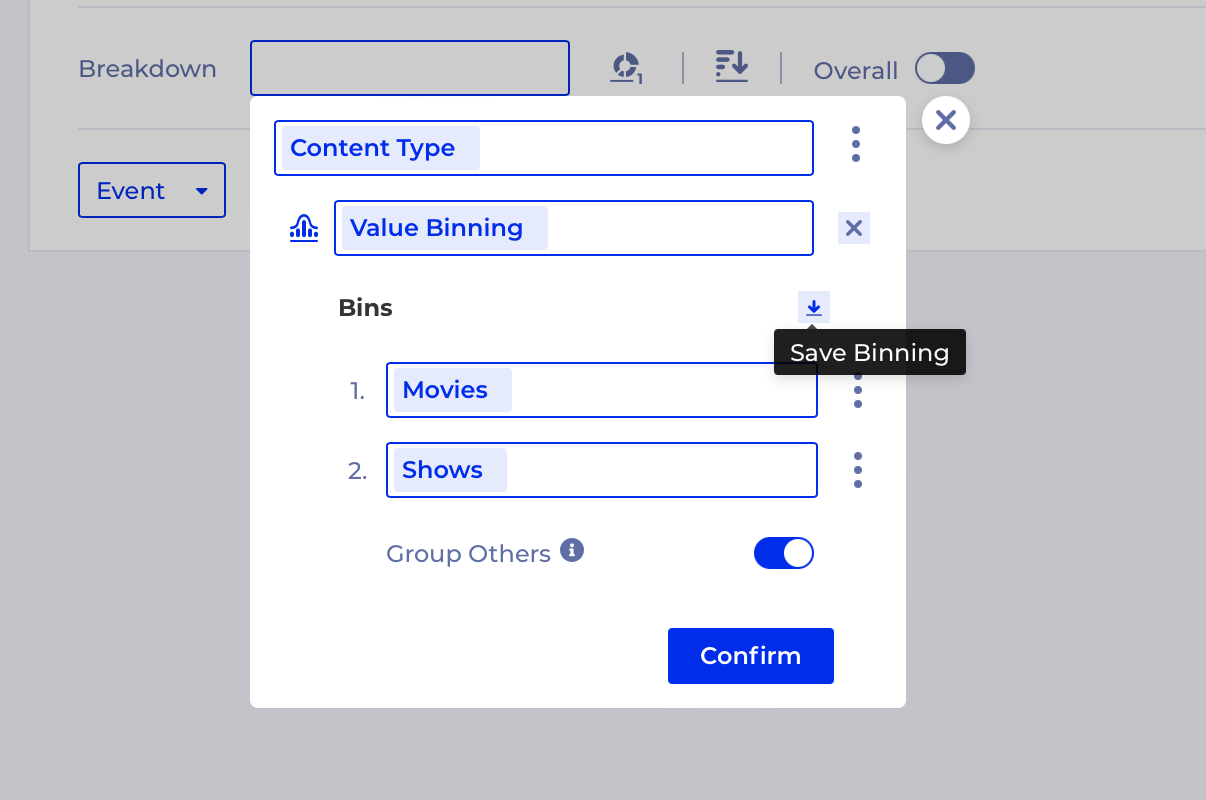
Binning is available when you click through the Context Menu of the Breakdown modal once you've added a Breakdown Field:
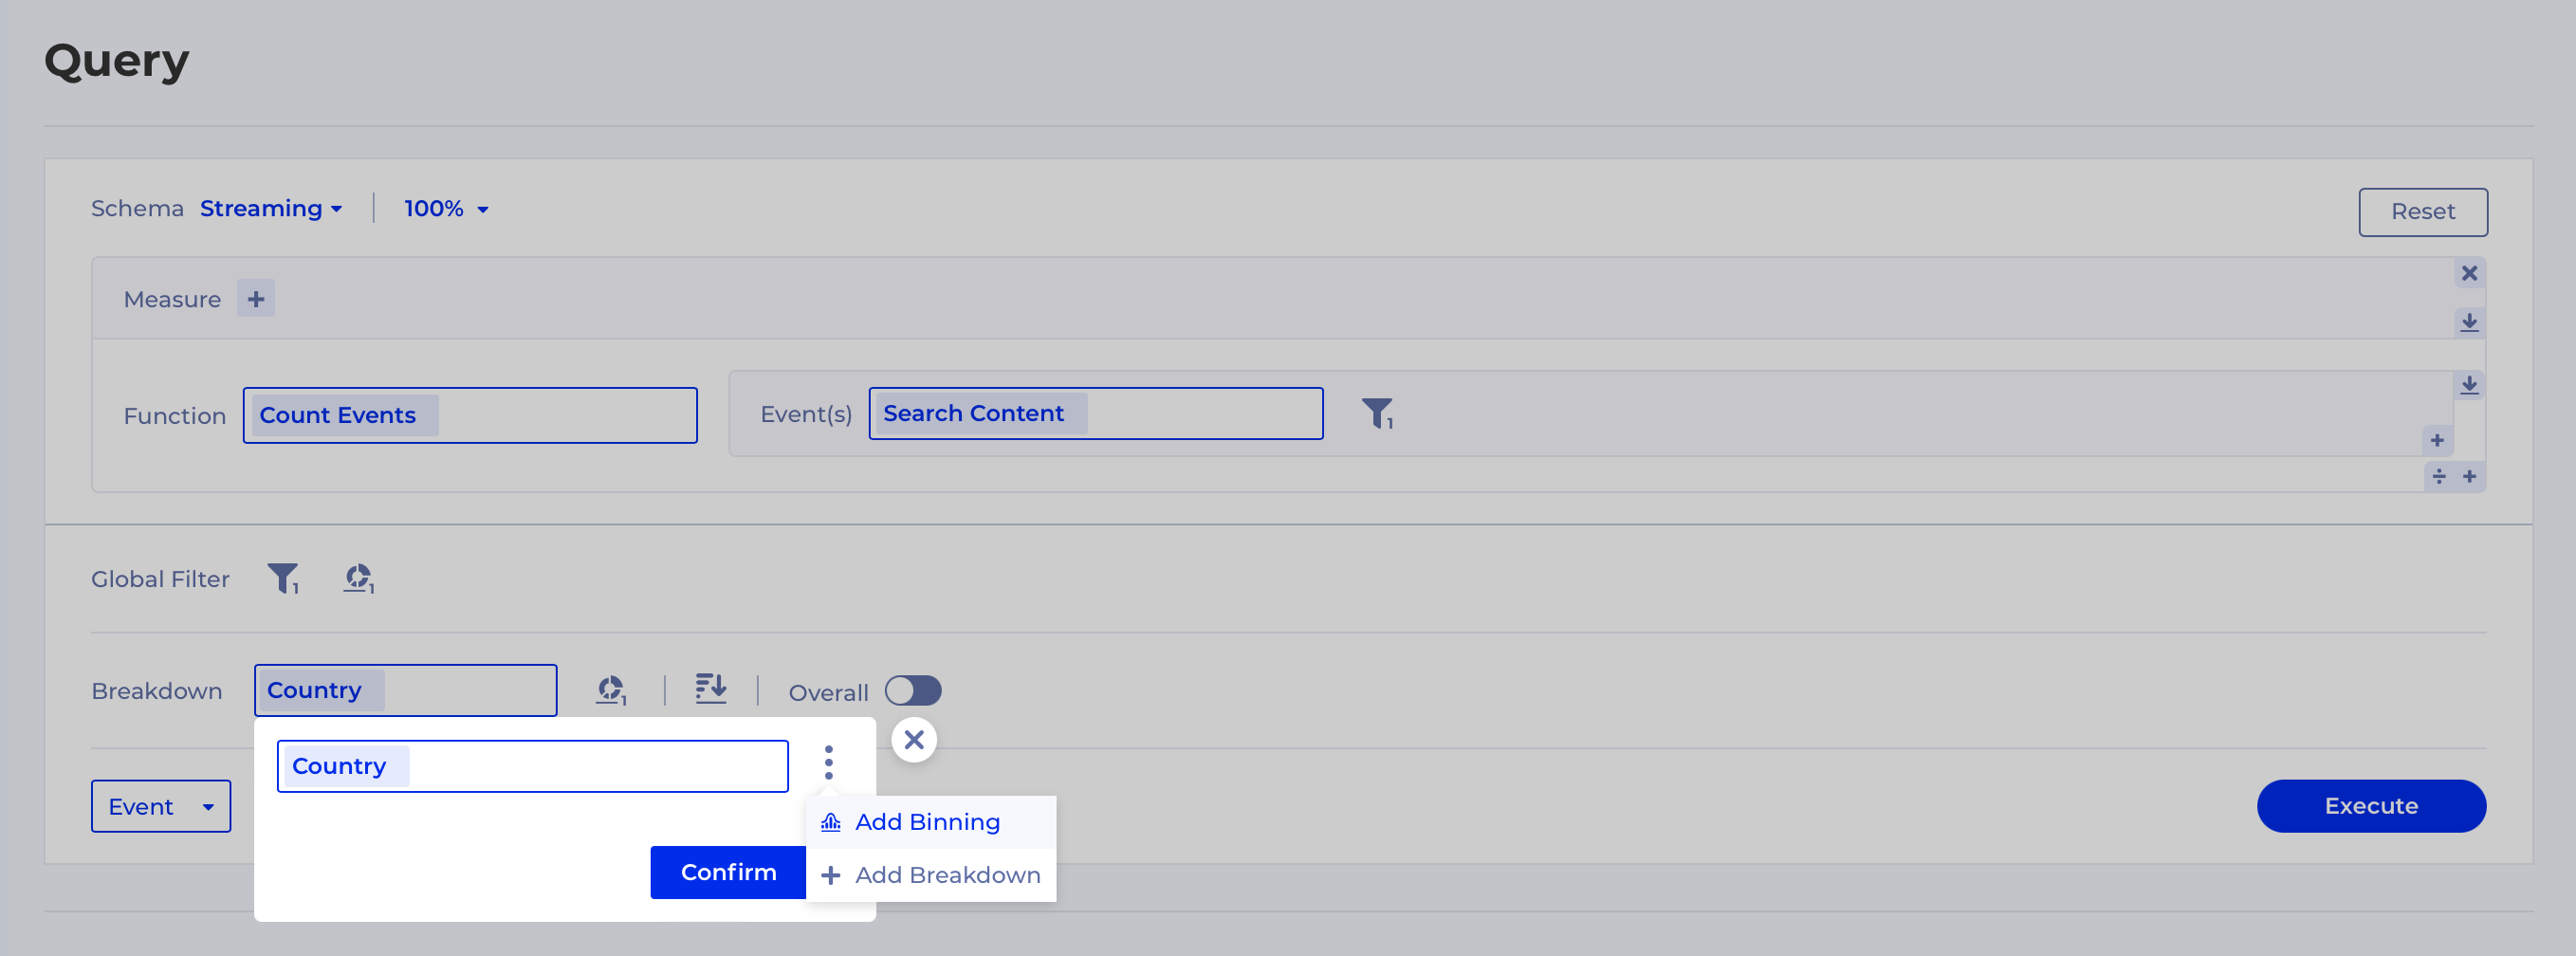
Binning can be a:
- Value Binning - available for all types of properties, use it to group multiple values in one bin (e.g. to define a custom geographical region or to correct instrumentation errors on the fly)
- Range Binning - available for numerical properties only, gives you a way to define custom ranges for each bin
Consider our example above, let's say we want to define 3 geographical regions:
- North America = United States, Canada and Mexico
- Europe = UK, France, Germany and Netherlands
- ROW = Rest of the World
To name a bin you've created click into the vertical "..." icon next to your bin and select "Edit Name". This allows you to give an easily interpreted name of the bin you've created.
We can use Value Binning to achieve this goal by explicitly defining the first two groups and then leave Group Others enabled to bunch all the other countries into one group like this:
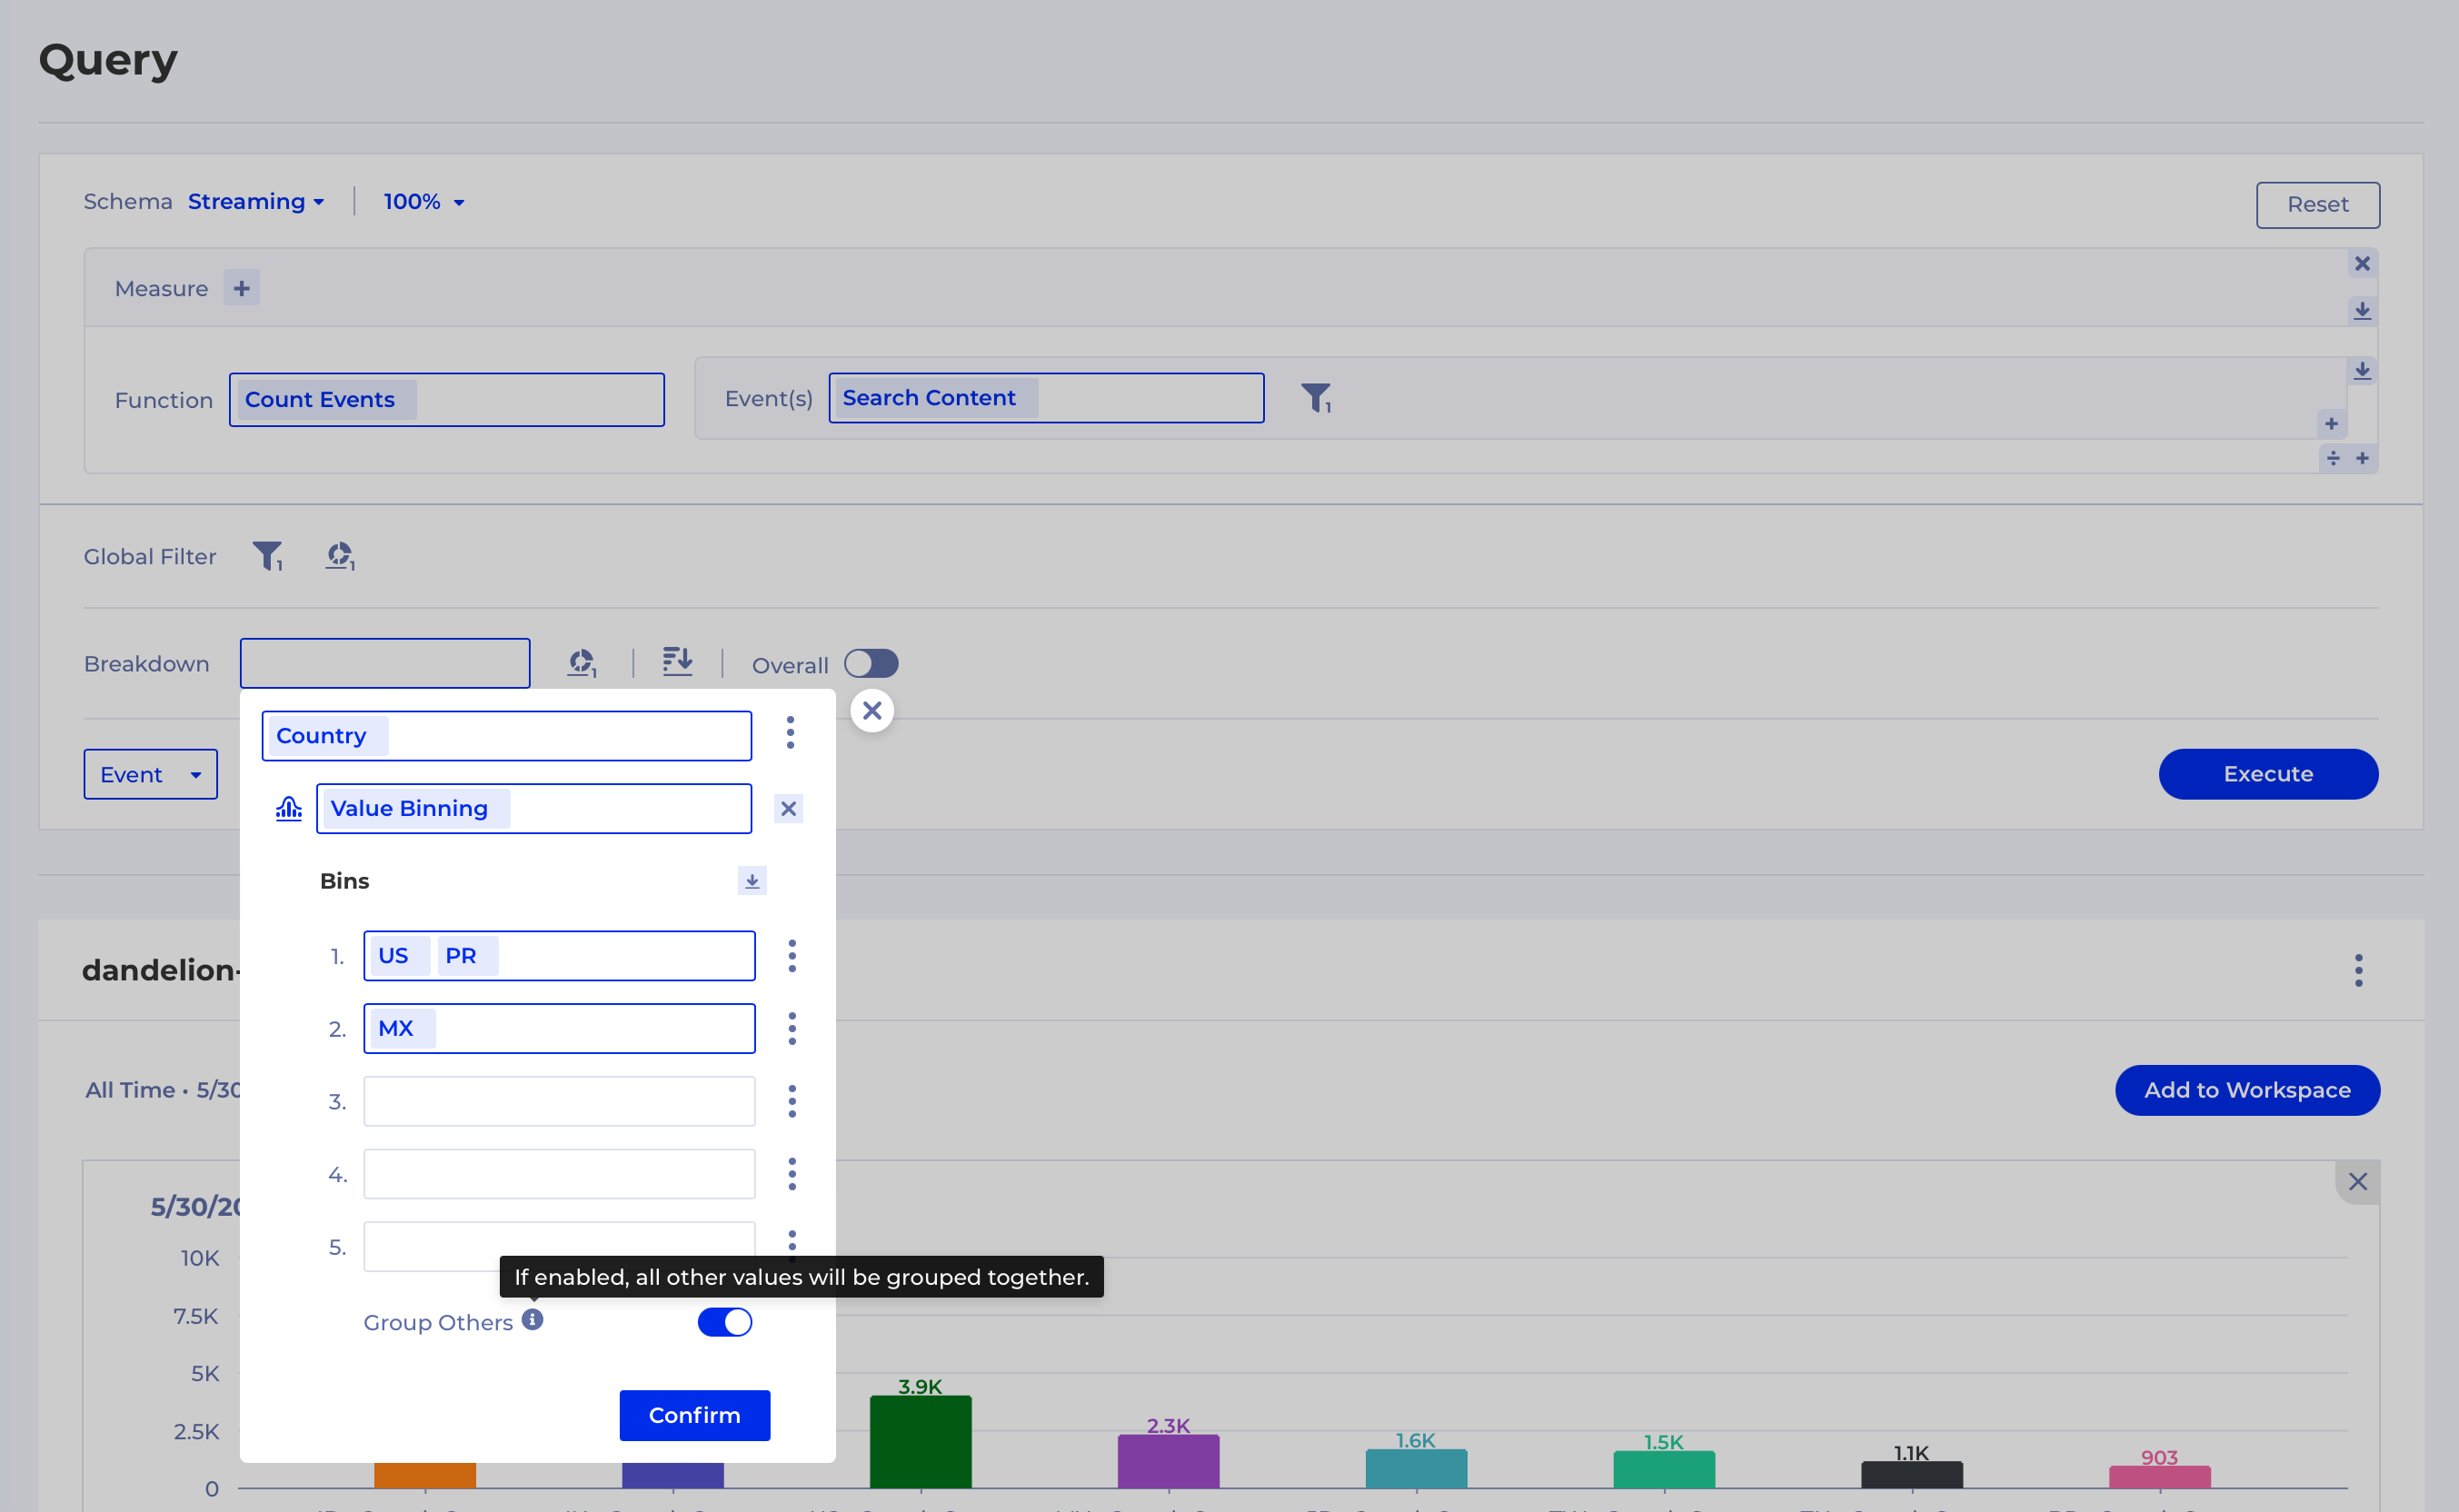
Toggling Group Others off would mean all the other groups will be displayed as is, which is what you typically want to do when fixing instrumentation glitches on different platforms.
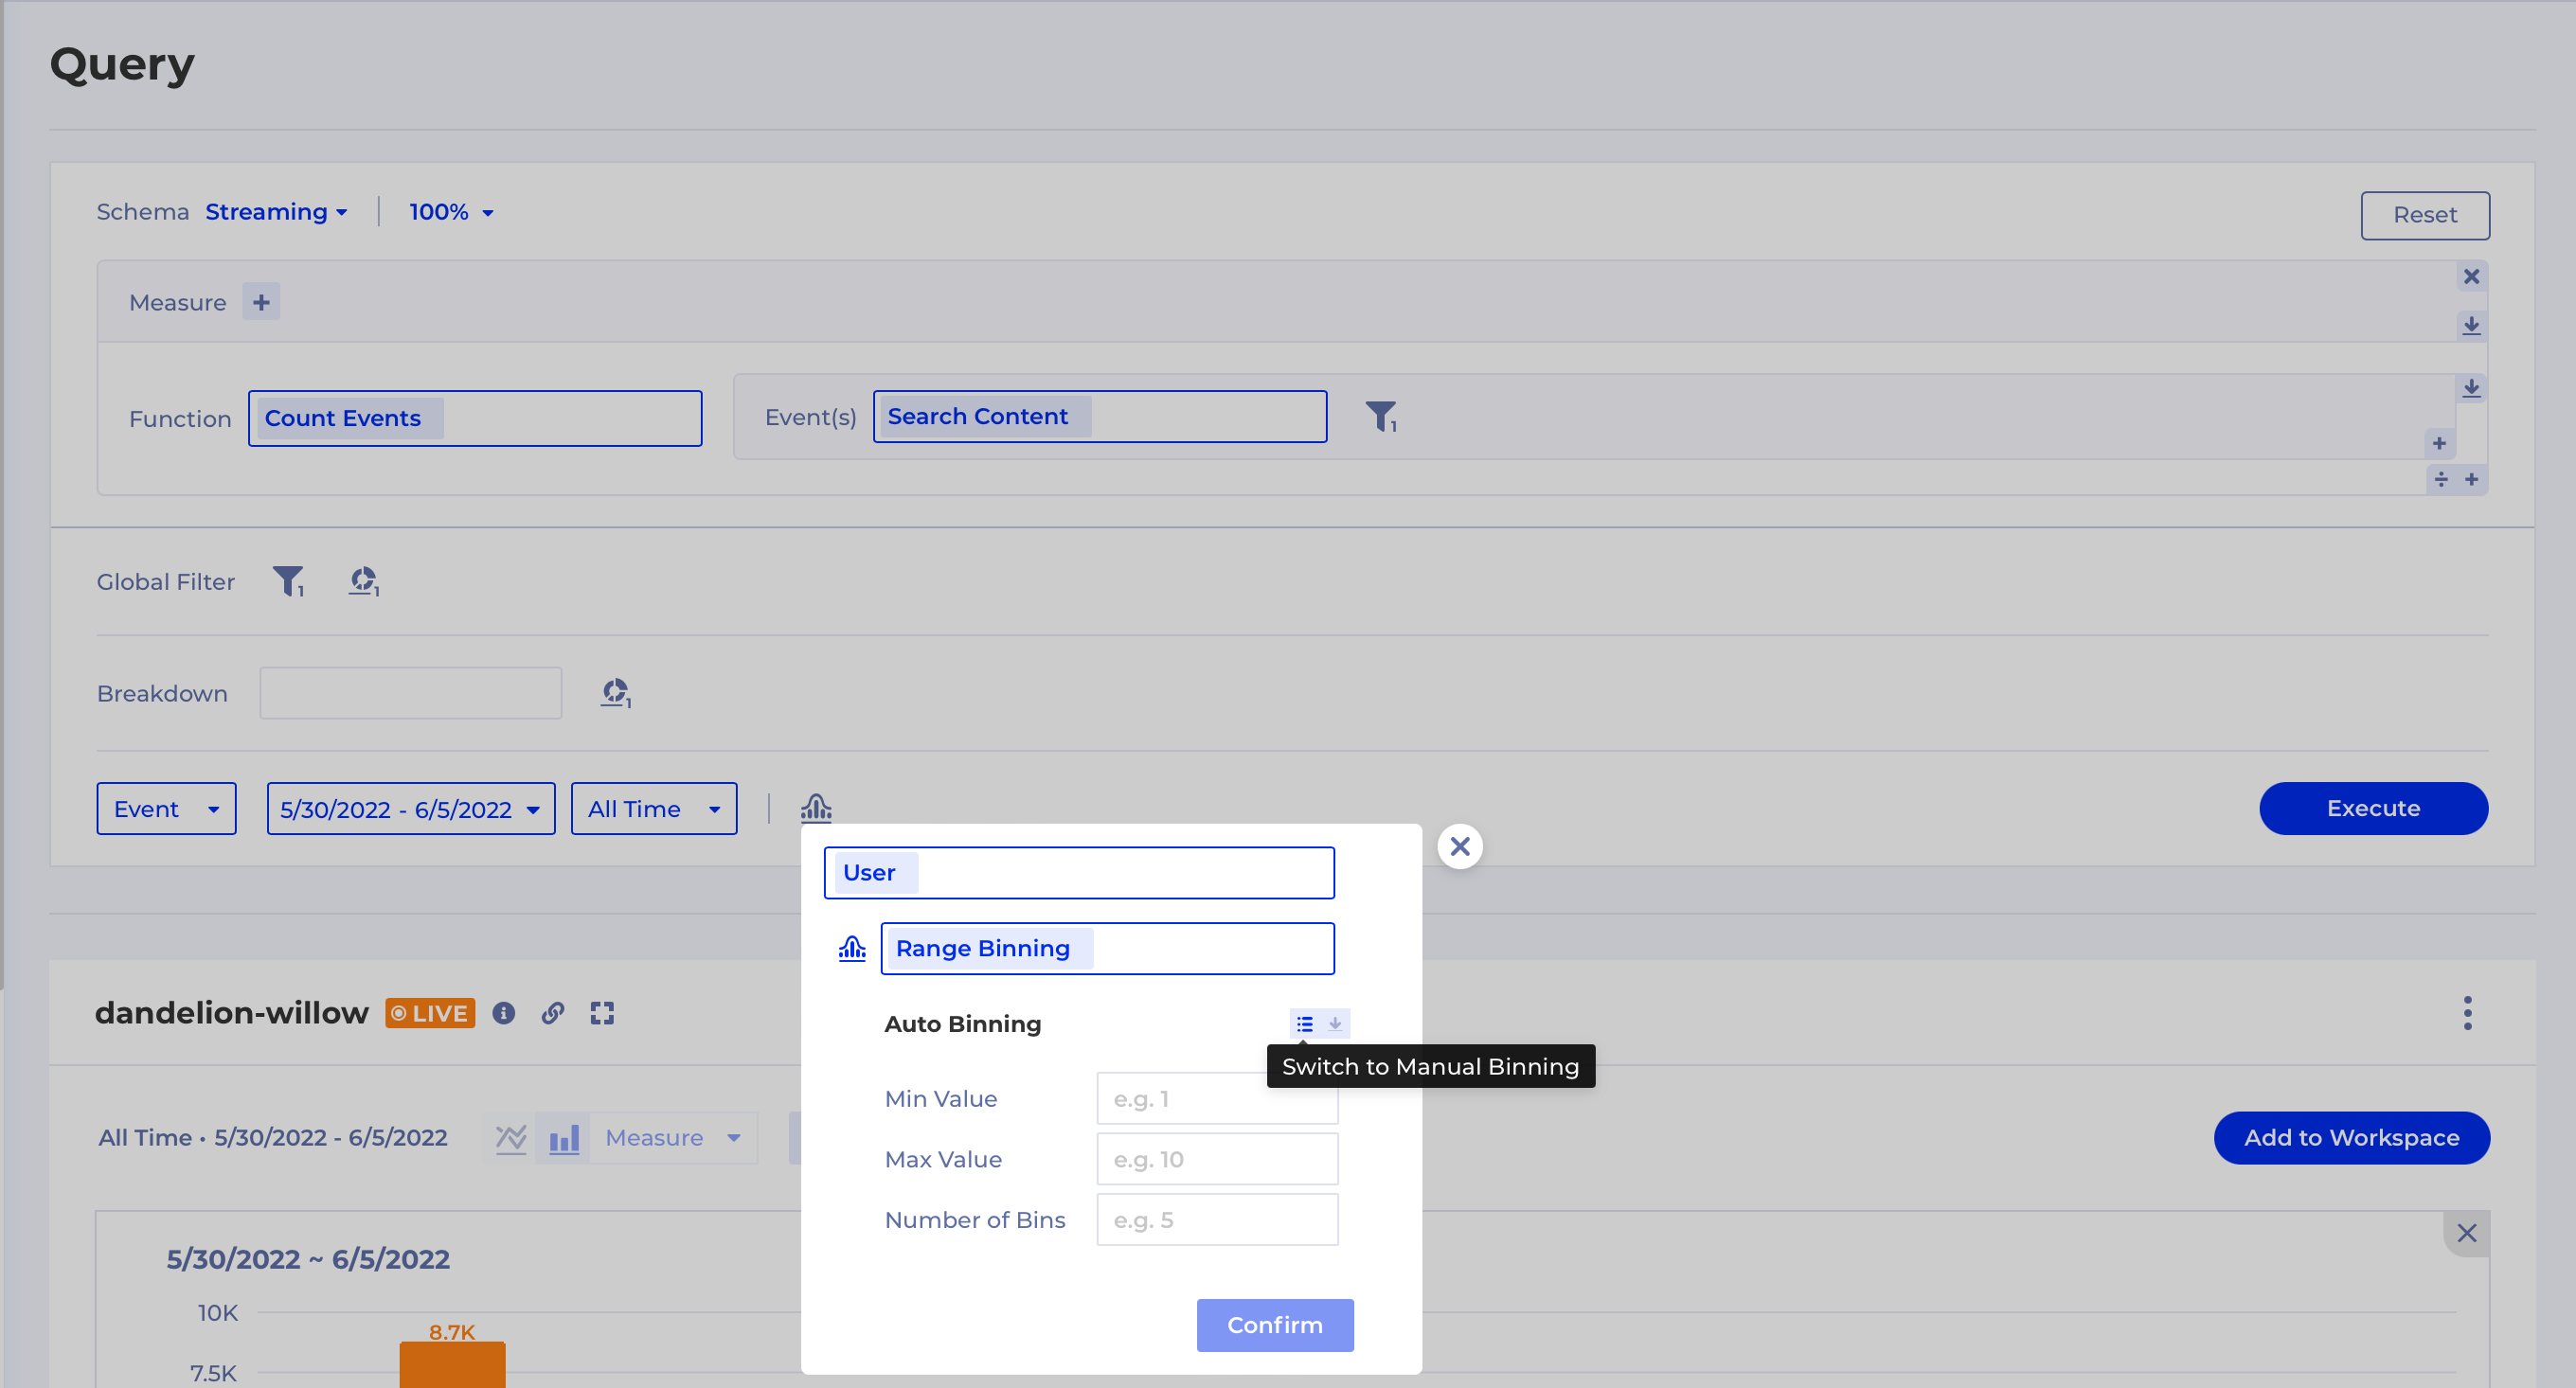
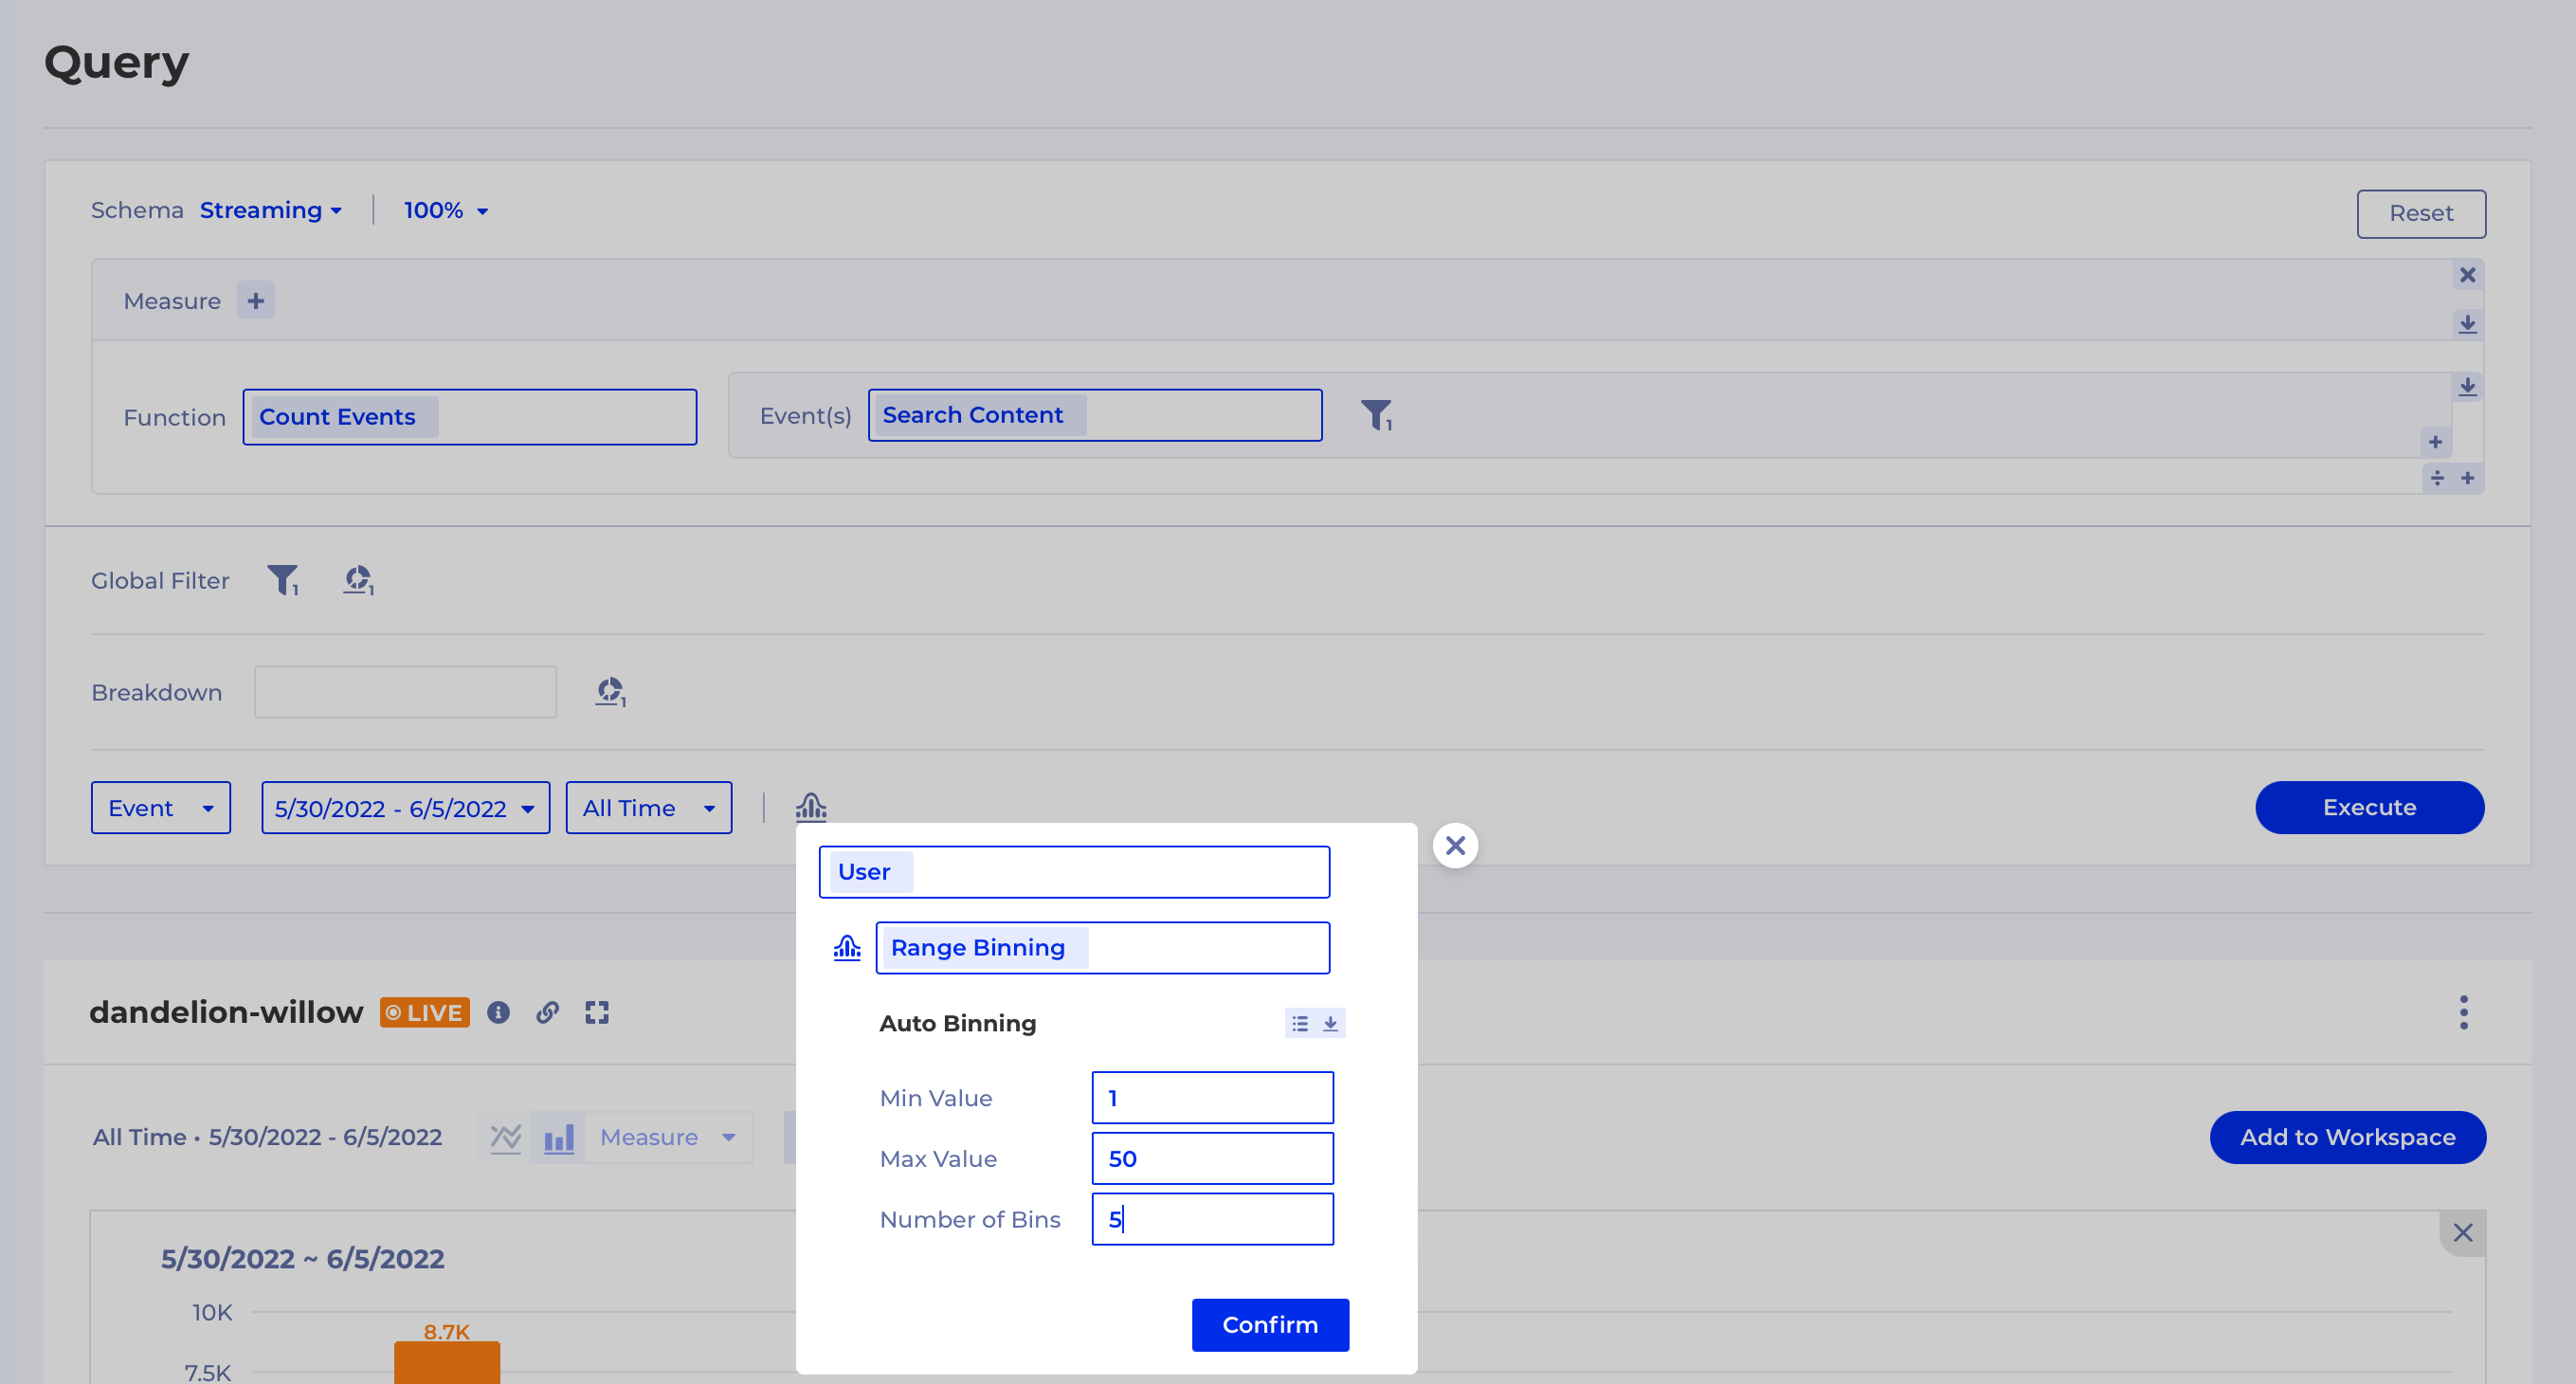
For Range Binning we have 2 additional modes:
- Auto Binning (default) - more on that in the next section
- Manual Binning - a way to define custom bin ranges
You can get to a Manual Binning by clicking on the icon shown below:
Histogram in Query
You will see that the way to create a histogram chart has been made a bit more intuitive - you just need to click on the histogram icon, choose your Subject and Binning:
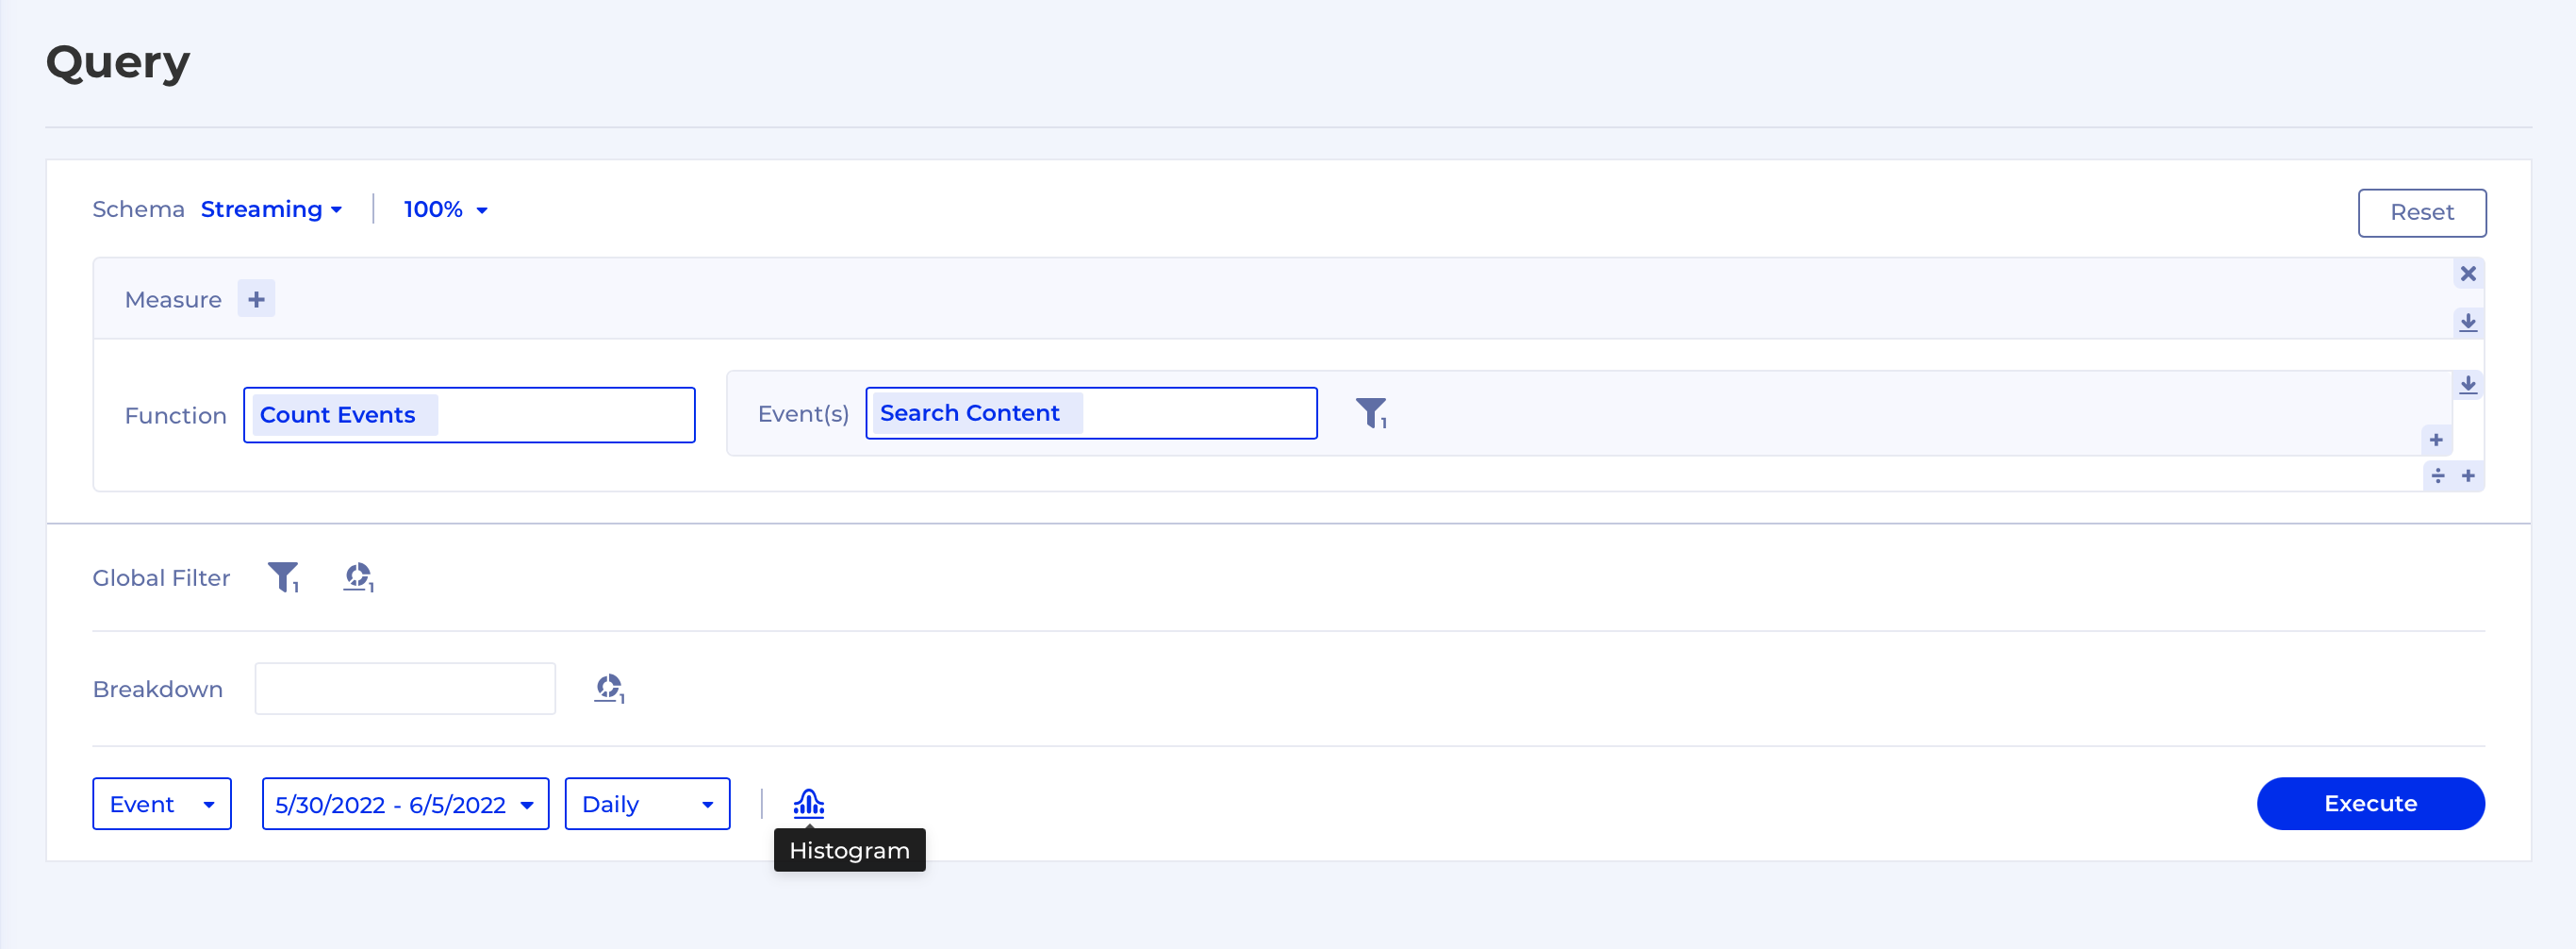
Only Range Binning is available for histogram charts where you can also leverage Auto Binning (default) which just creates evenly sized bins based on a min, max and a number of bins:
Save Binnings
To facilitate reuse and collaboration Kubit also provides a way to save a Binning. Just hit the save icon and it will be available in autocomplete and in Dictionary:
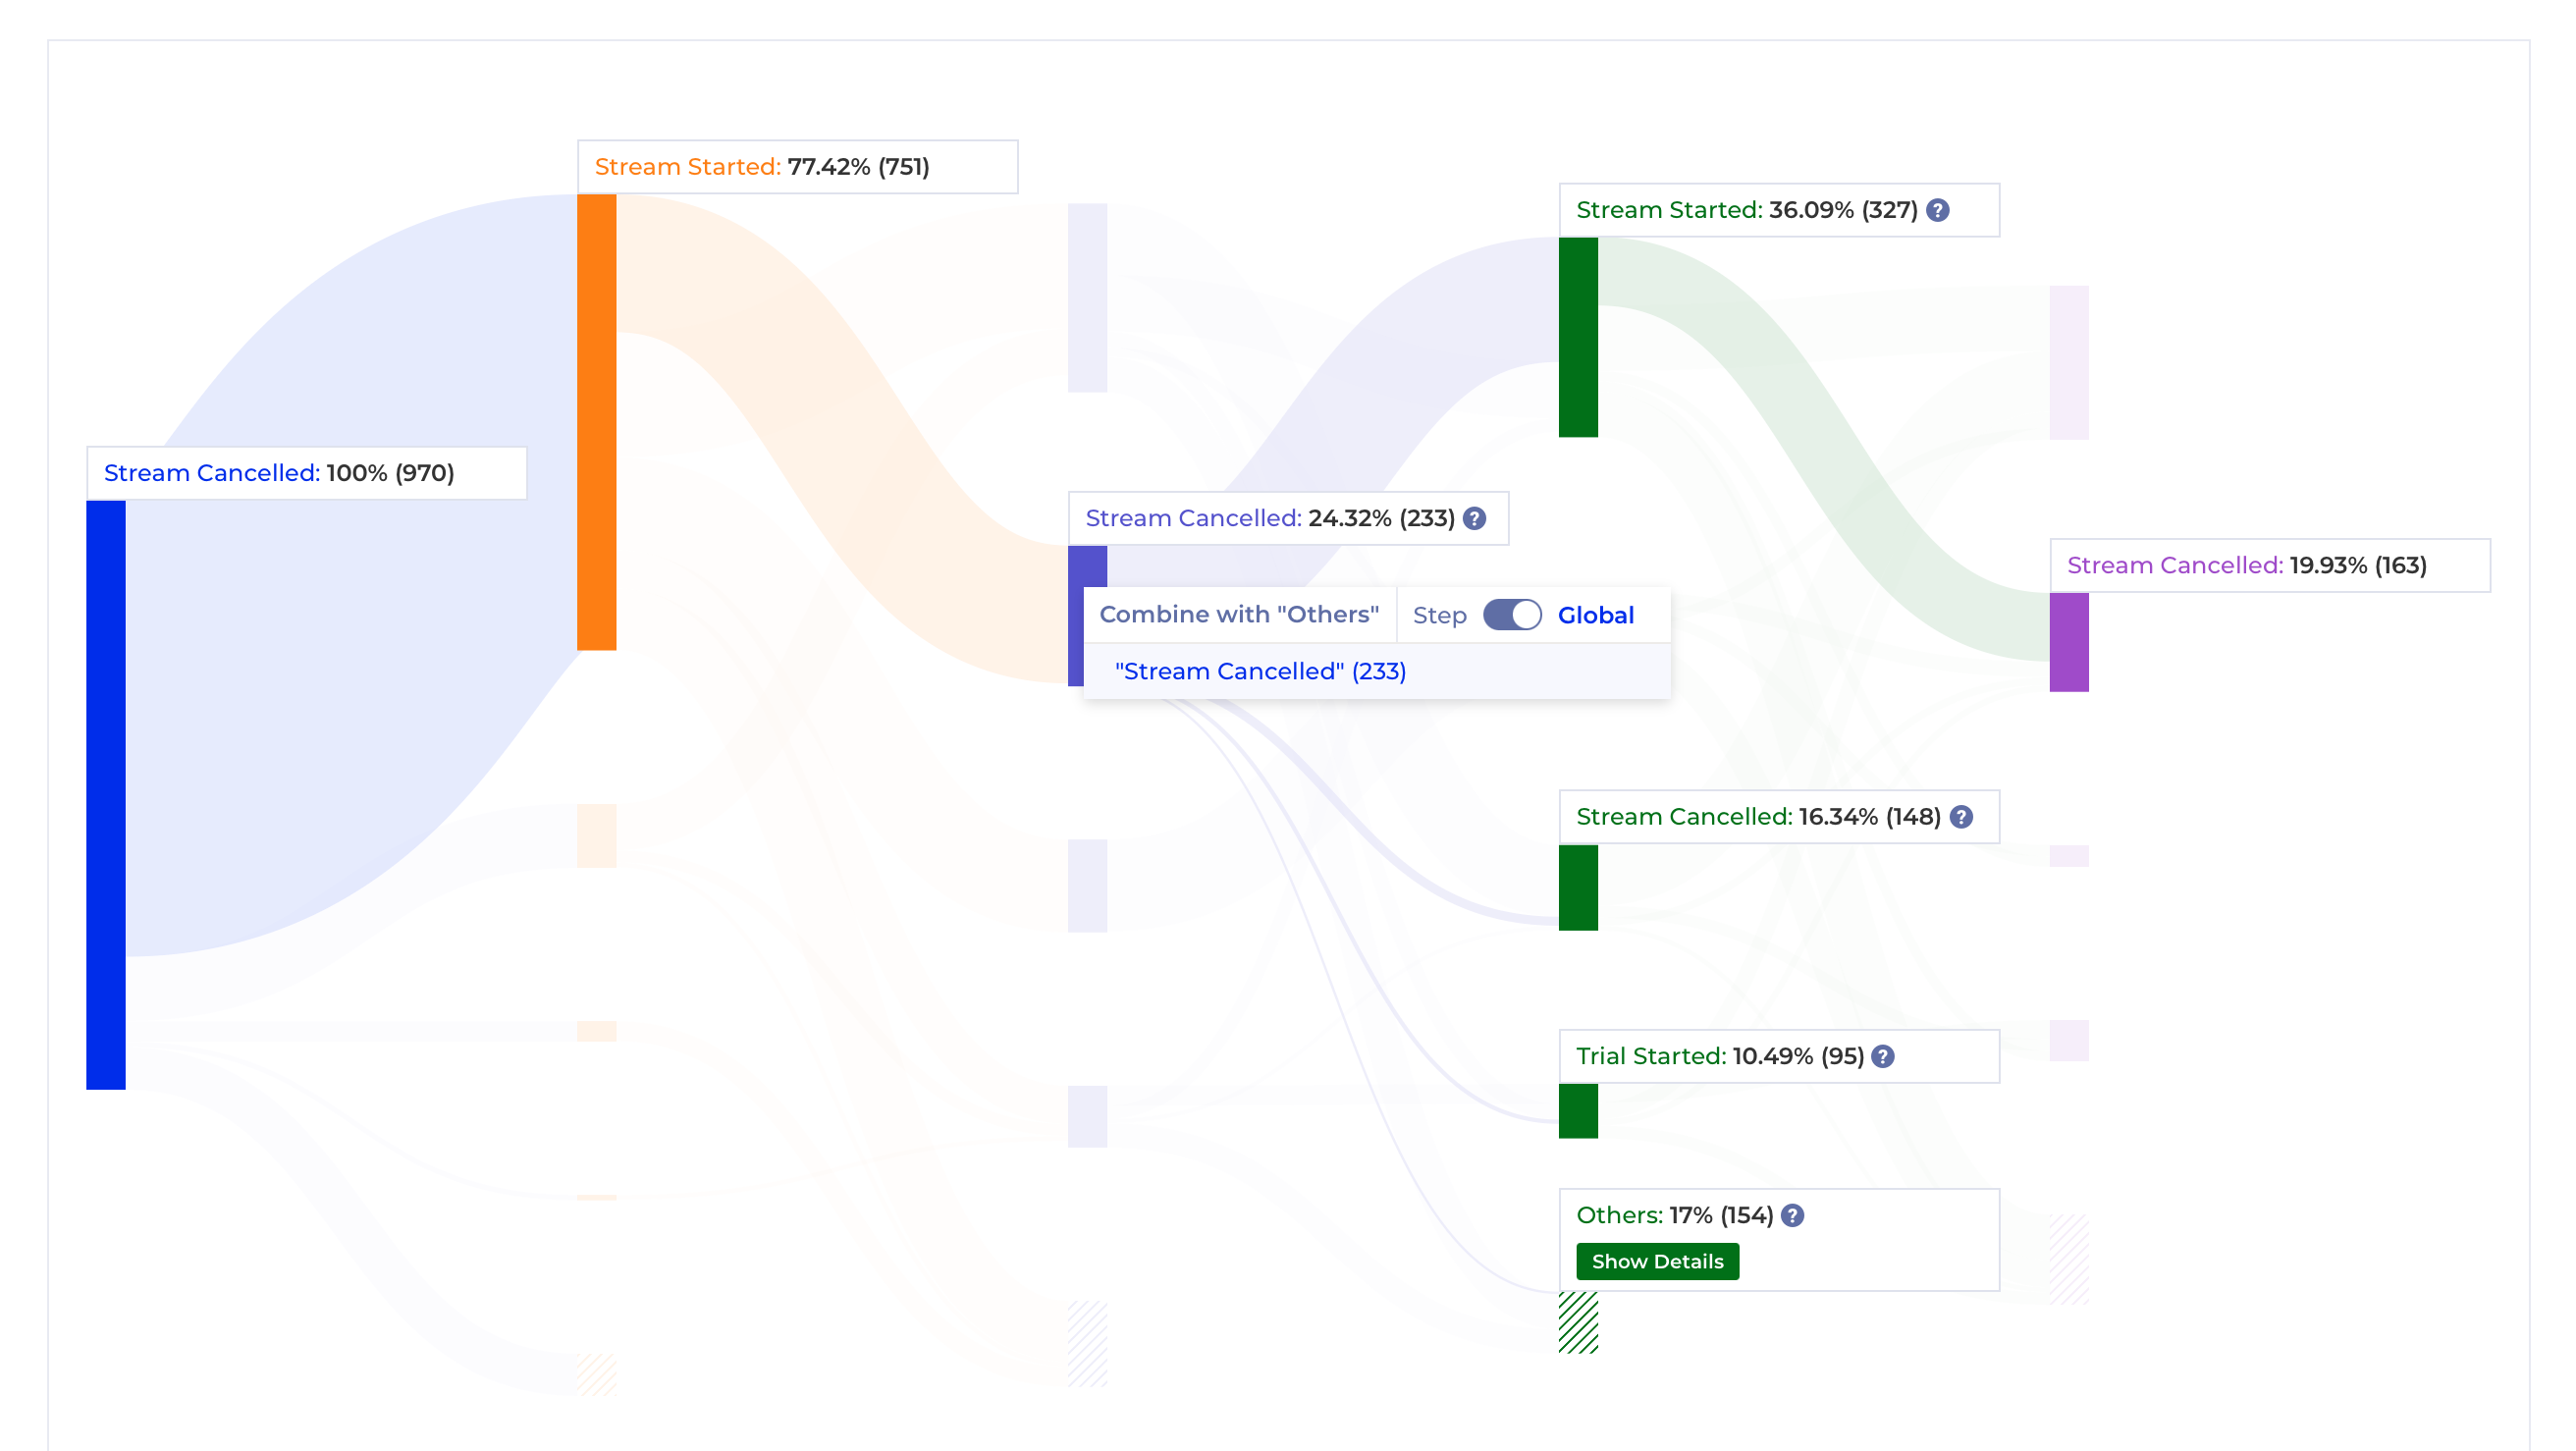
Ability to easily exclude Events from Path
We've added the ability to easily hide certain Paths by grouping them with Others but also to show the paths that are less taken by taking them out of the Others group. In order to get to this feature you need to right-click on a step in the path like this:
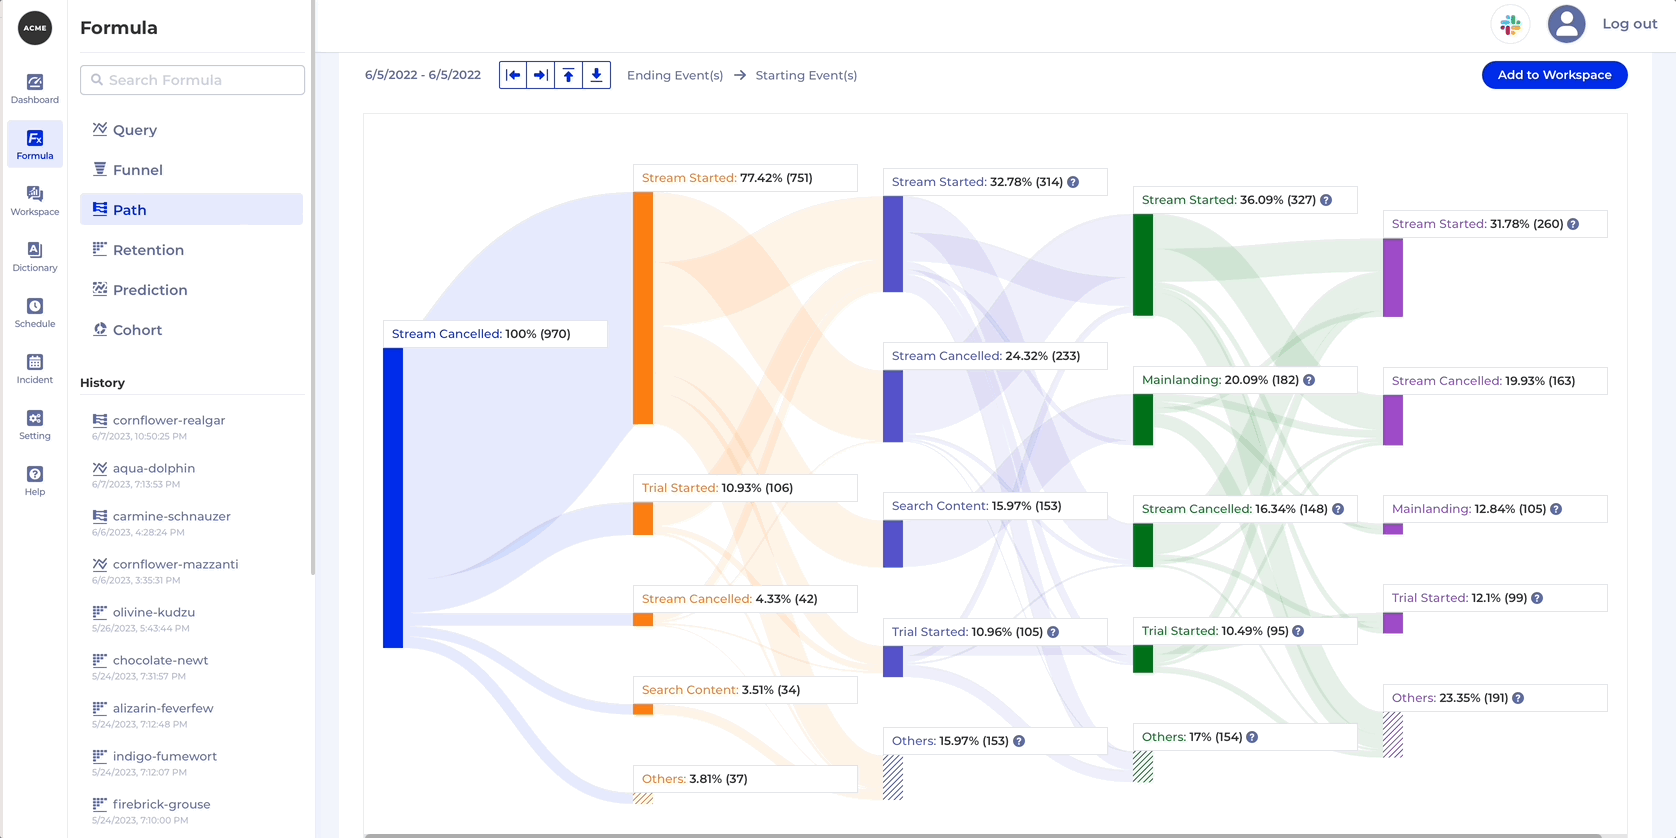
In the example above you may have noticed that there is a toggle between Step and Global. Step is the default and it means the event is excluded from the chart only for the selected step, whereas Global removes the event from all the steps, therefore hiding all the paths which contain it.