R300 - 2023-05-25
- Funnel Chart now shows relative conversion between the steps by default
- You can see Chart Creator through the Info icon for every Chart
- Ability to Create Cohort from Query and Funnel with Breakdown
- Event-specific Fields
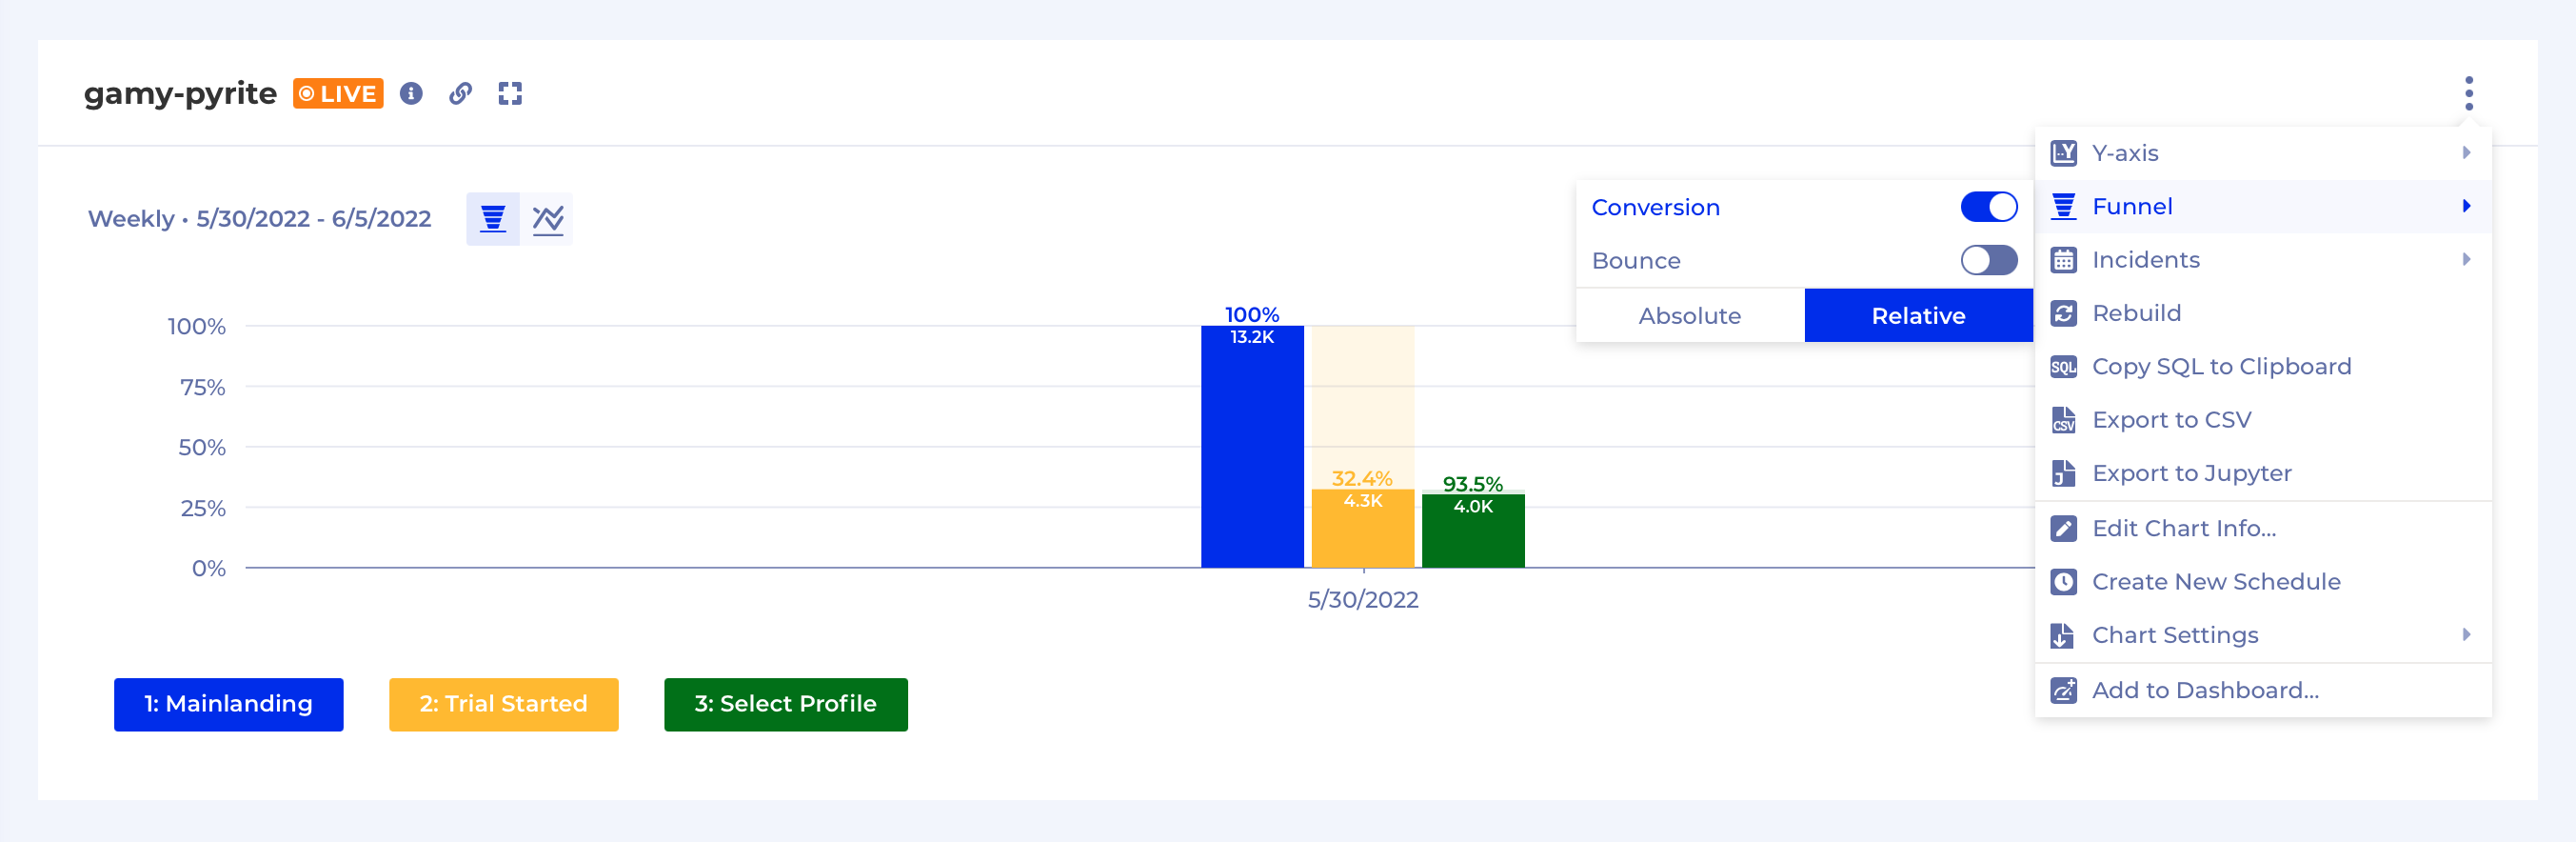
Funnel Chart now shows relative conversion between the steps by default
Funnel Charts used to display the absolute conversion by default, meaning the % converted on step N would be computed by dividing the count on step N by the count on step 1. Now the default has changed to Relative, meaning the conversion % will be computed by dividing the count of step N to the count of step N-1.
You can still go back to that mode from the Chart's Context Menu as shown below.
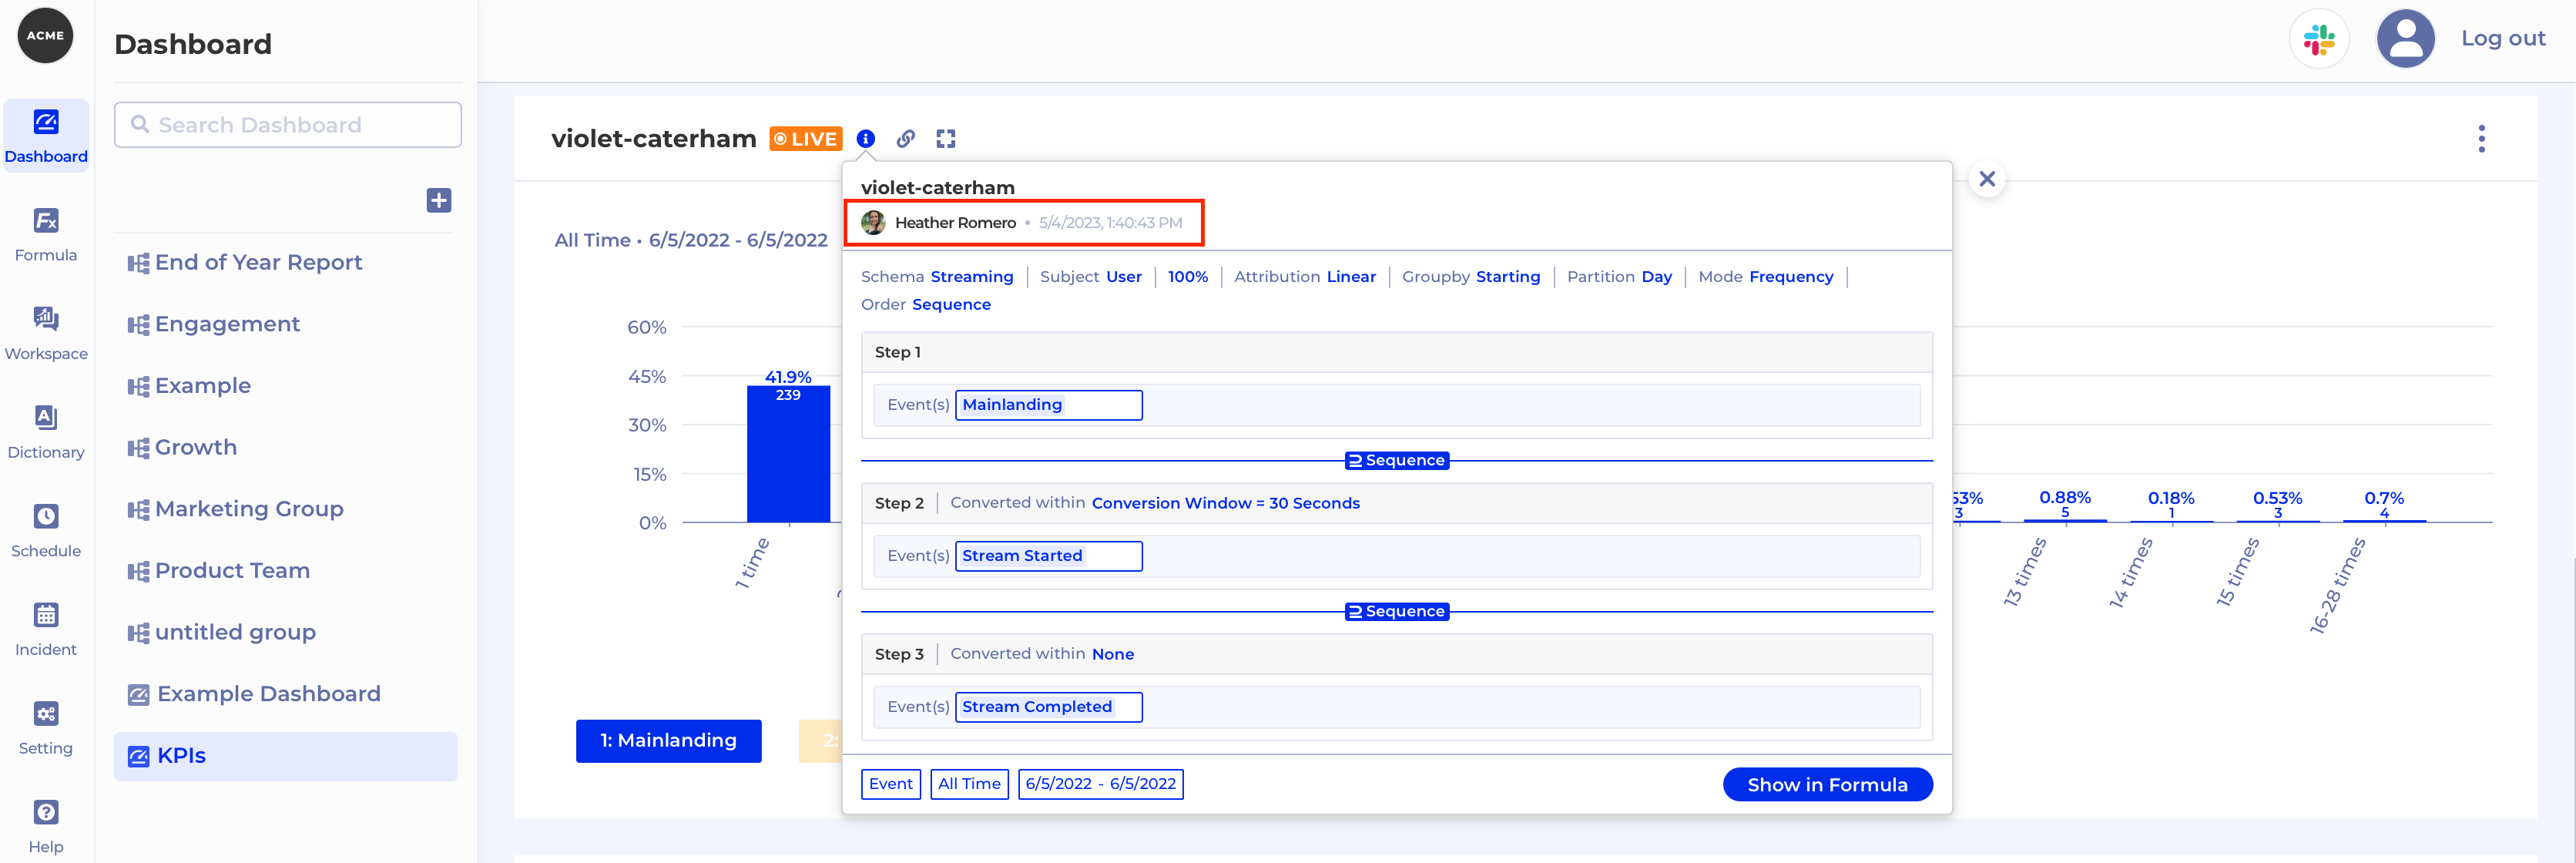
You can see Chart Creator through the Info icon for every Chart
You can now find who and when created an analysis by clicking on the i icon of an analysis anywhere in Kubit:
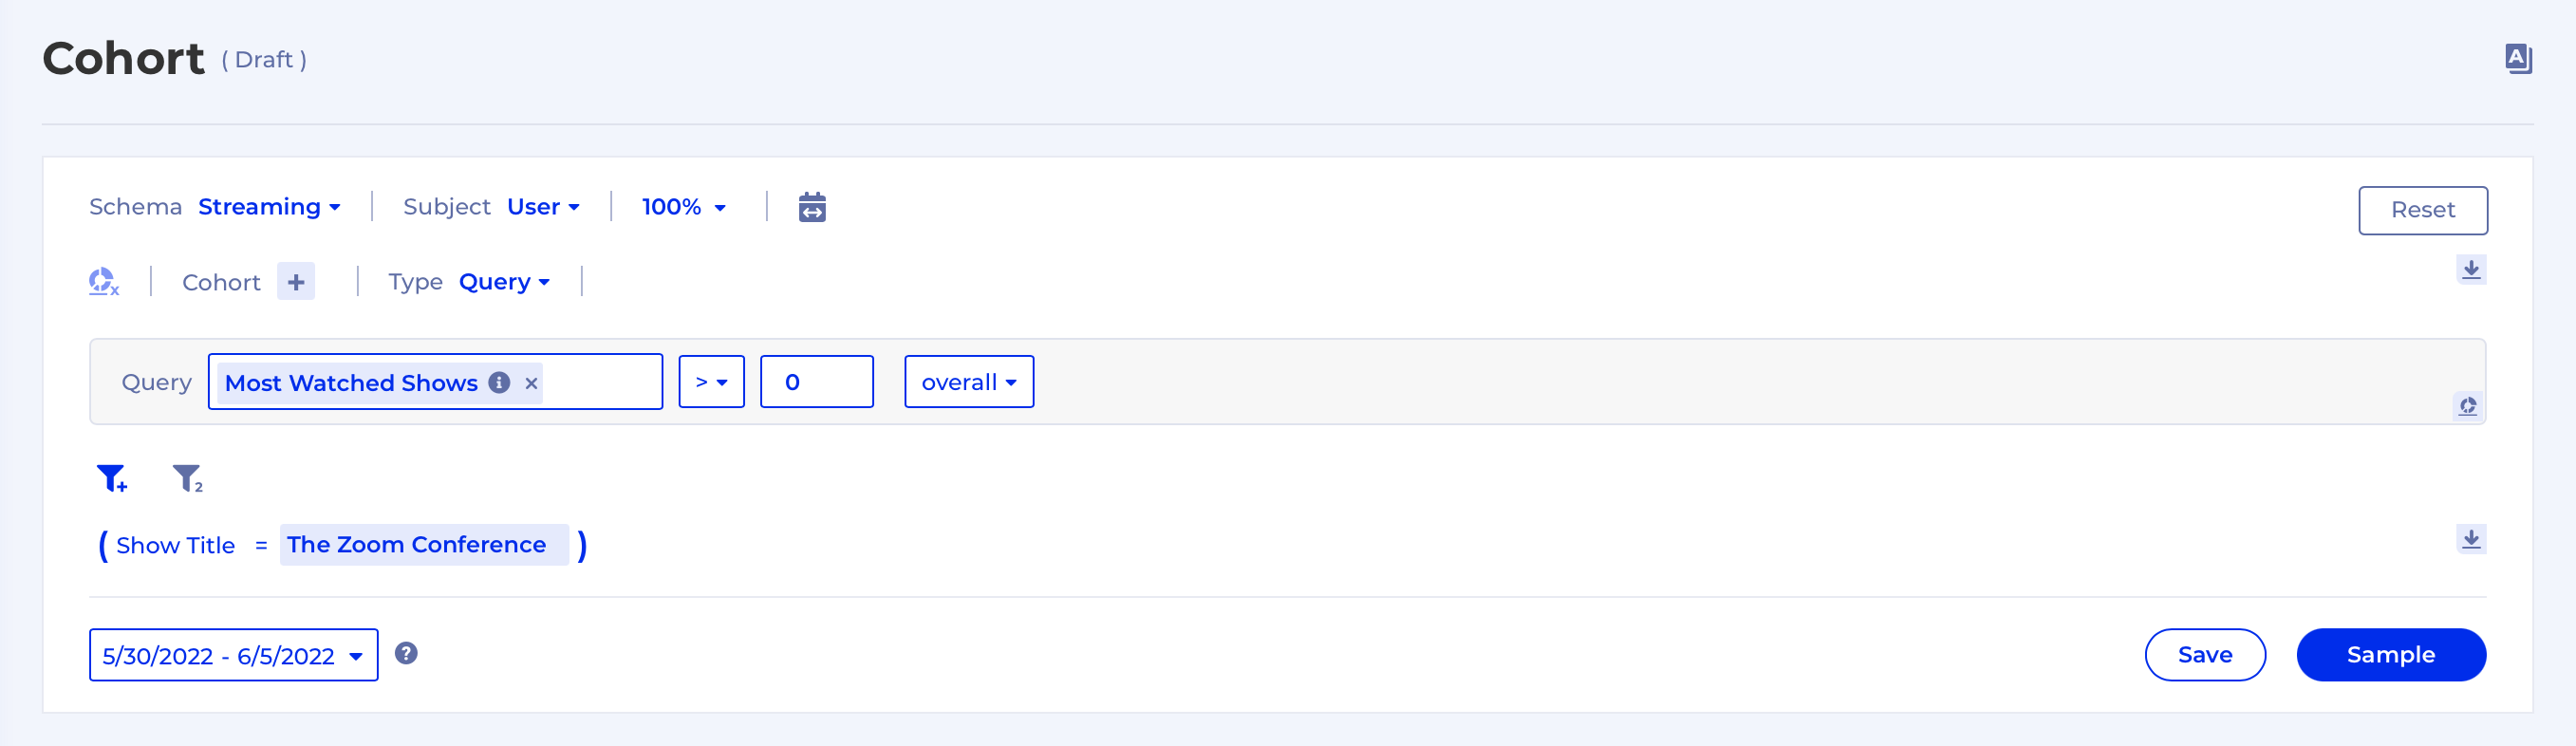
Ability to Create Cohorts from Query and Funnel with Breakdown
Say you want to save a specific segment of users for further Cohort analysis. Now you can do that directly from a Query or a Funnel chart which has a Breakdown through the group's context menu:
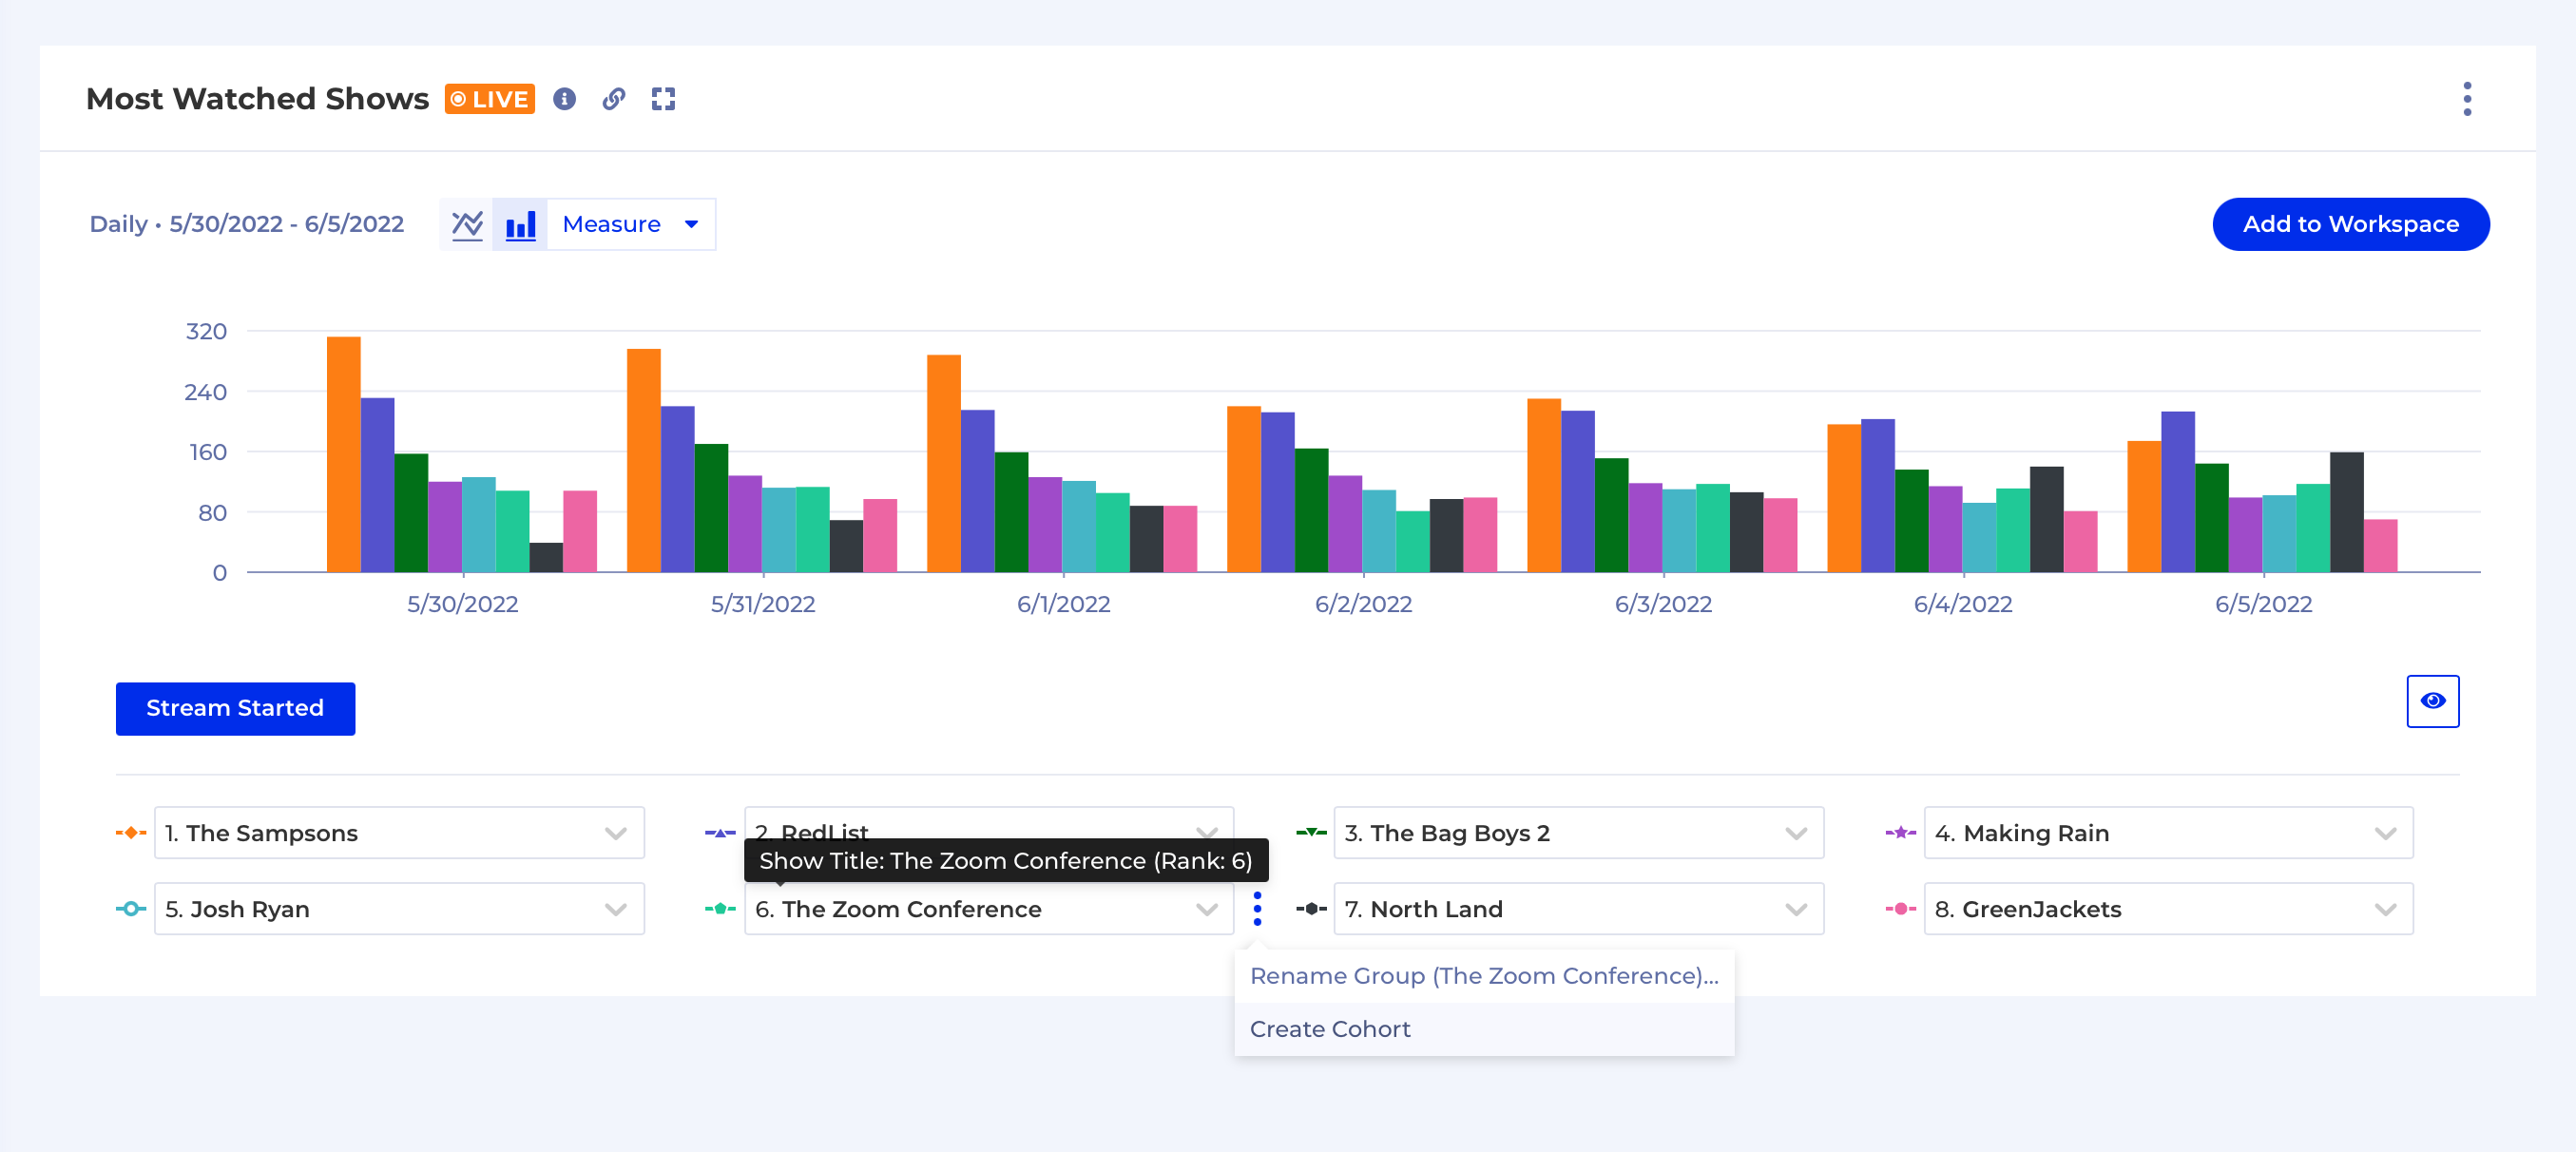
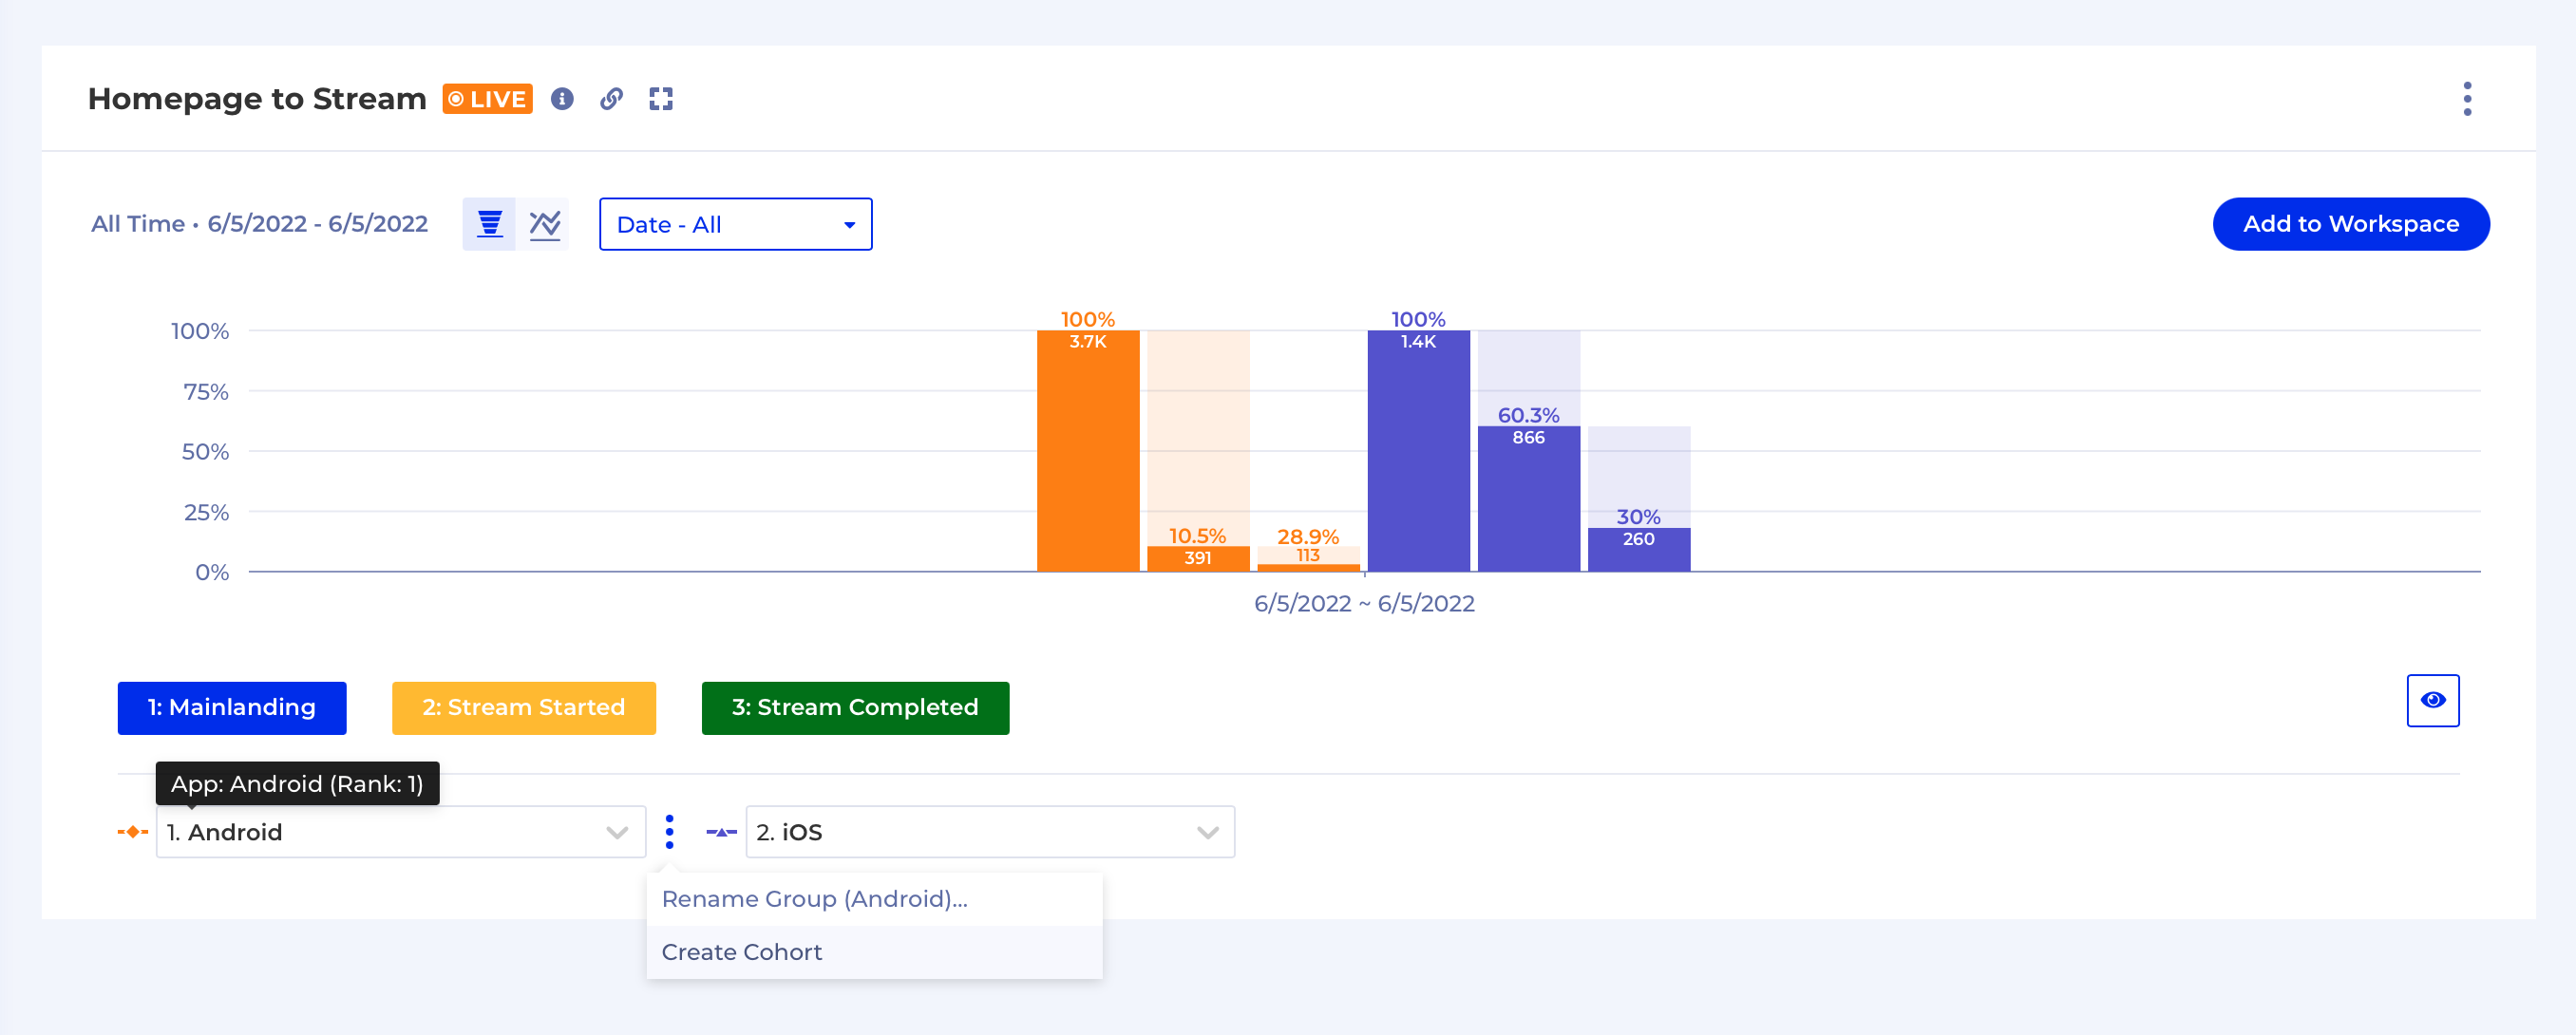
Once you click on Create Cohort you will be transferred to the Cohort Builder where you can Sample the Cohort, Save it or export it to your favourite Customer Data Platform (CDP).
Event-specific Fields
Data can sometimes be difficult to follow - all events have a set of fields, but some events have specific fields, so the full list of fields is a union of all common + all specific fields. To help you navigate this more easily we updated the autocomplete in Measure/Step Filters to only show the Fields which are available for the already selected Events.
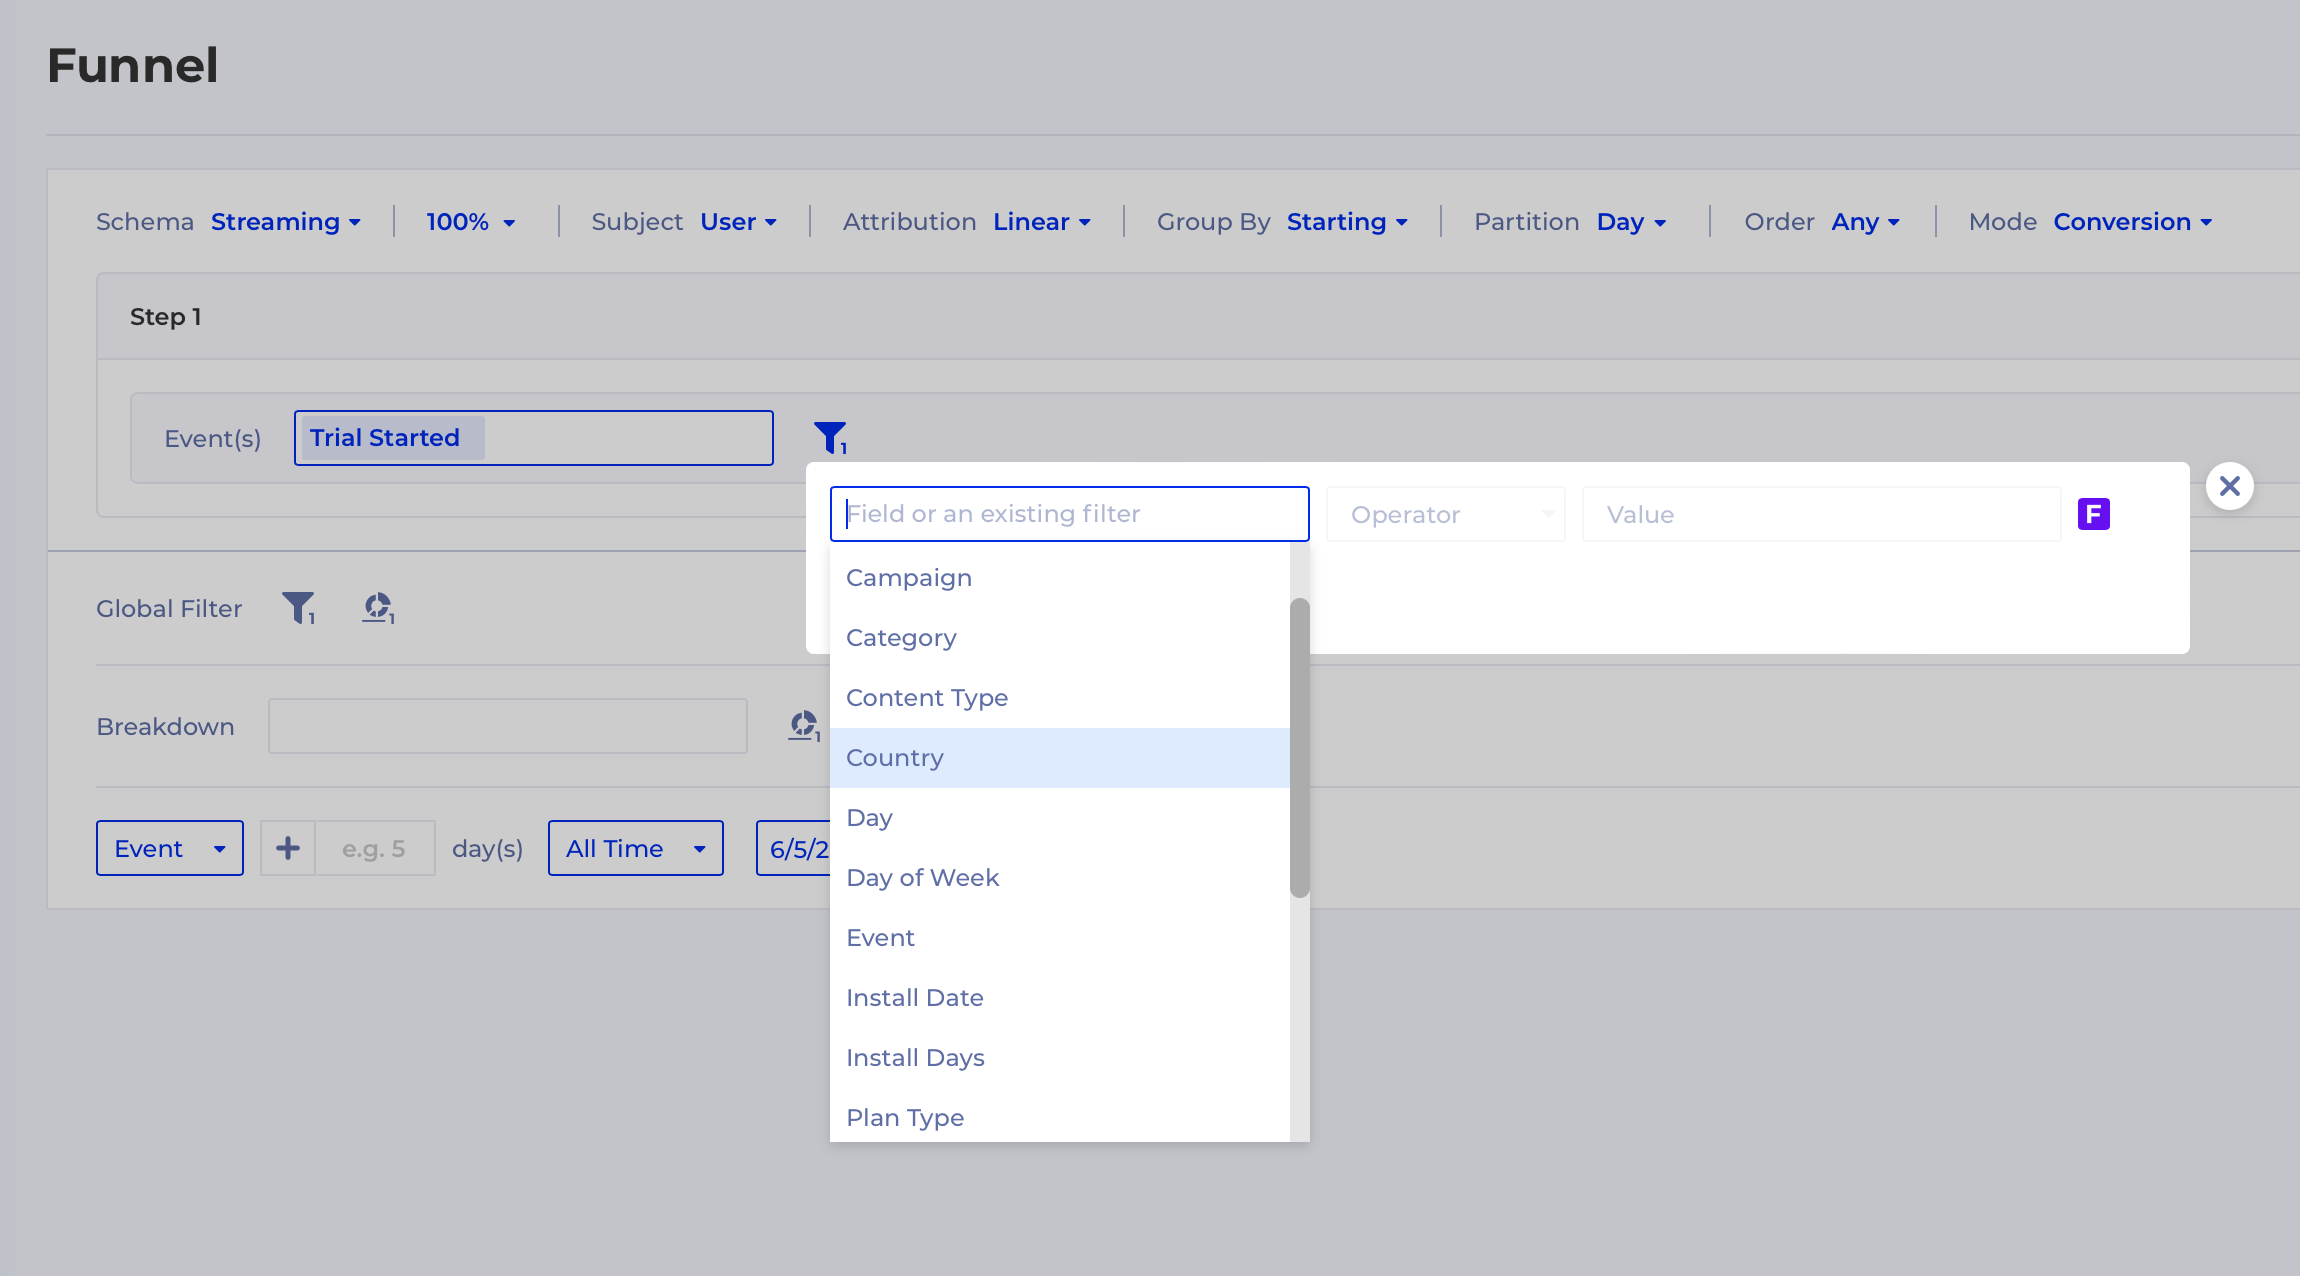
In case Any event is selected the autocomplete will suggest from the whole set of available Fields.
NotePlease, note that none of the above applies to the Global Filter where you will always see suggestions from the full list of values in the autocomplete.