Improved
R296 - 2023-04-28
April 28th, 2023 by Stefan Enev
- Change how a Chart looks directly on the Dashboard
- Ability to truncate the Y-axis in Line chart Funnels
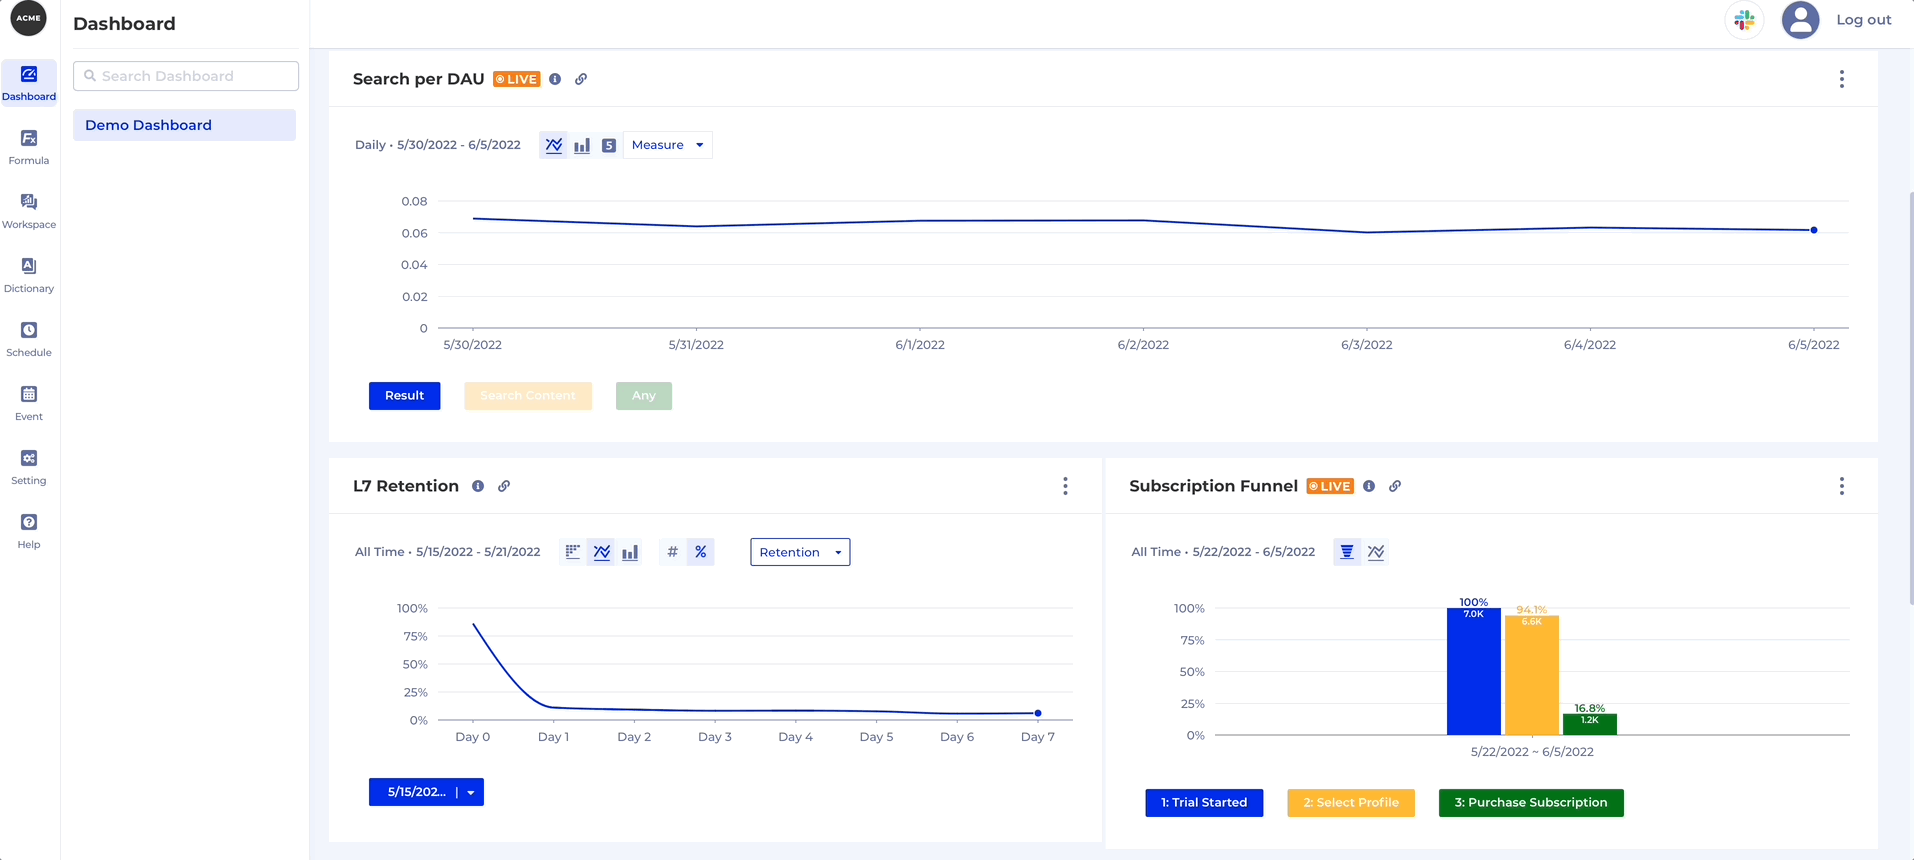
Change how a Chart looks on the Dashboard
You can modify the Chart Settings of each Chart directly on the Dashboard, namely the:
- Chart Type
- Y-axis settings
- Measure Format
- Measure Display
Here's how you change the Chart Settings on a Dashboard:
Good to knowRemember to Save the Chart Settings from the Chart's Context Menu when you're done making changes.
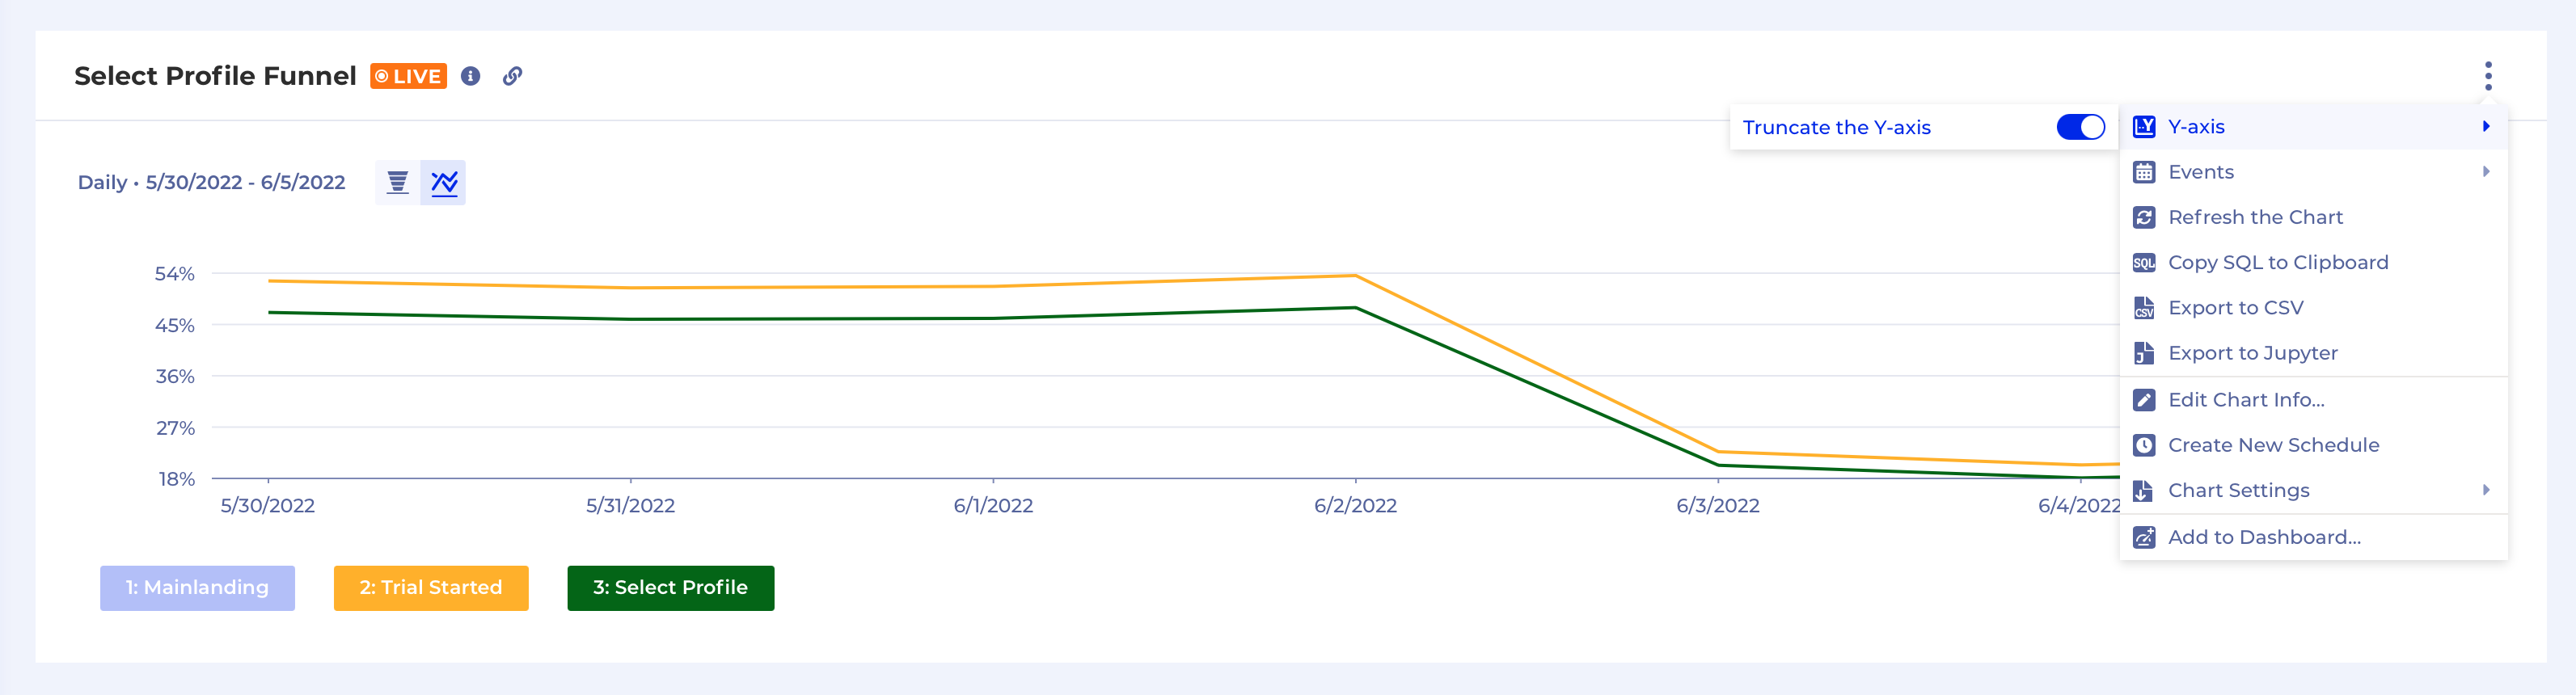
Ability to truncate the Y-axis in Line chart Funnels
Sometimes in a linear Funnel conversion between steps could be really close over time and in order to see better you need to truncate the Y-axis. Now you can do it from the Context Menu: