R295 - 2023-04-21
- Increased the maximum Breakdown Groups available for selection on a Chart from 25 to 100
- Improved Retention date range input
- Added
Overalloption for Paths with a Breakdown
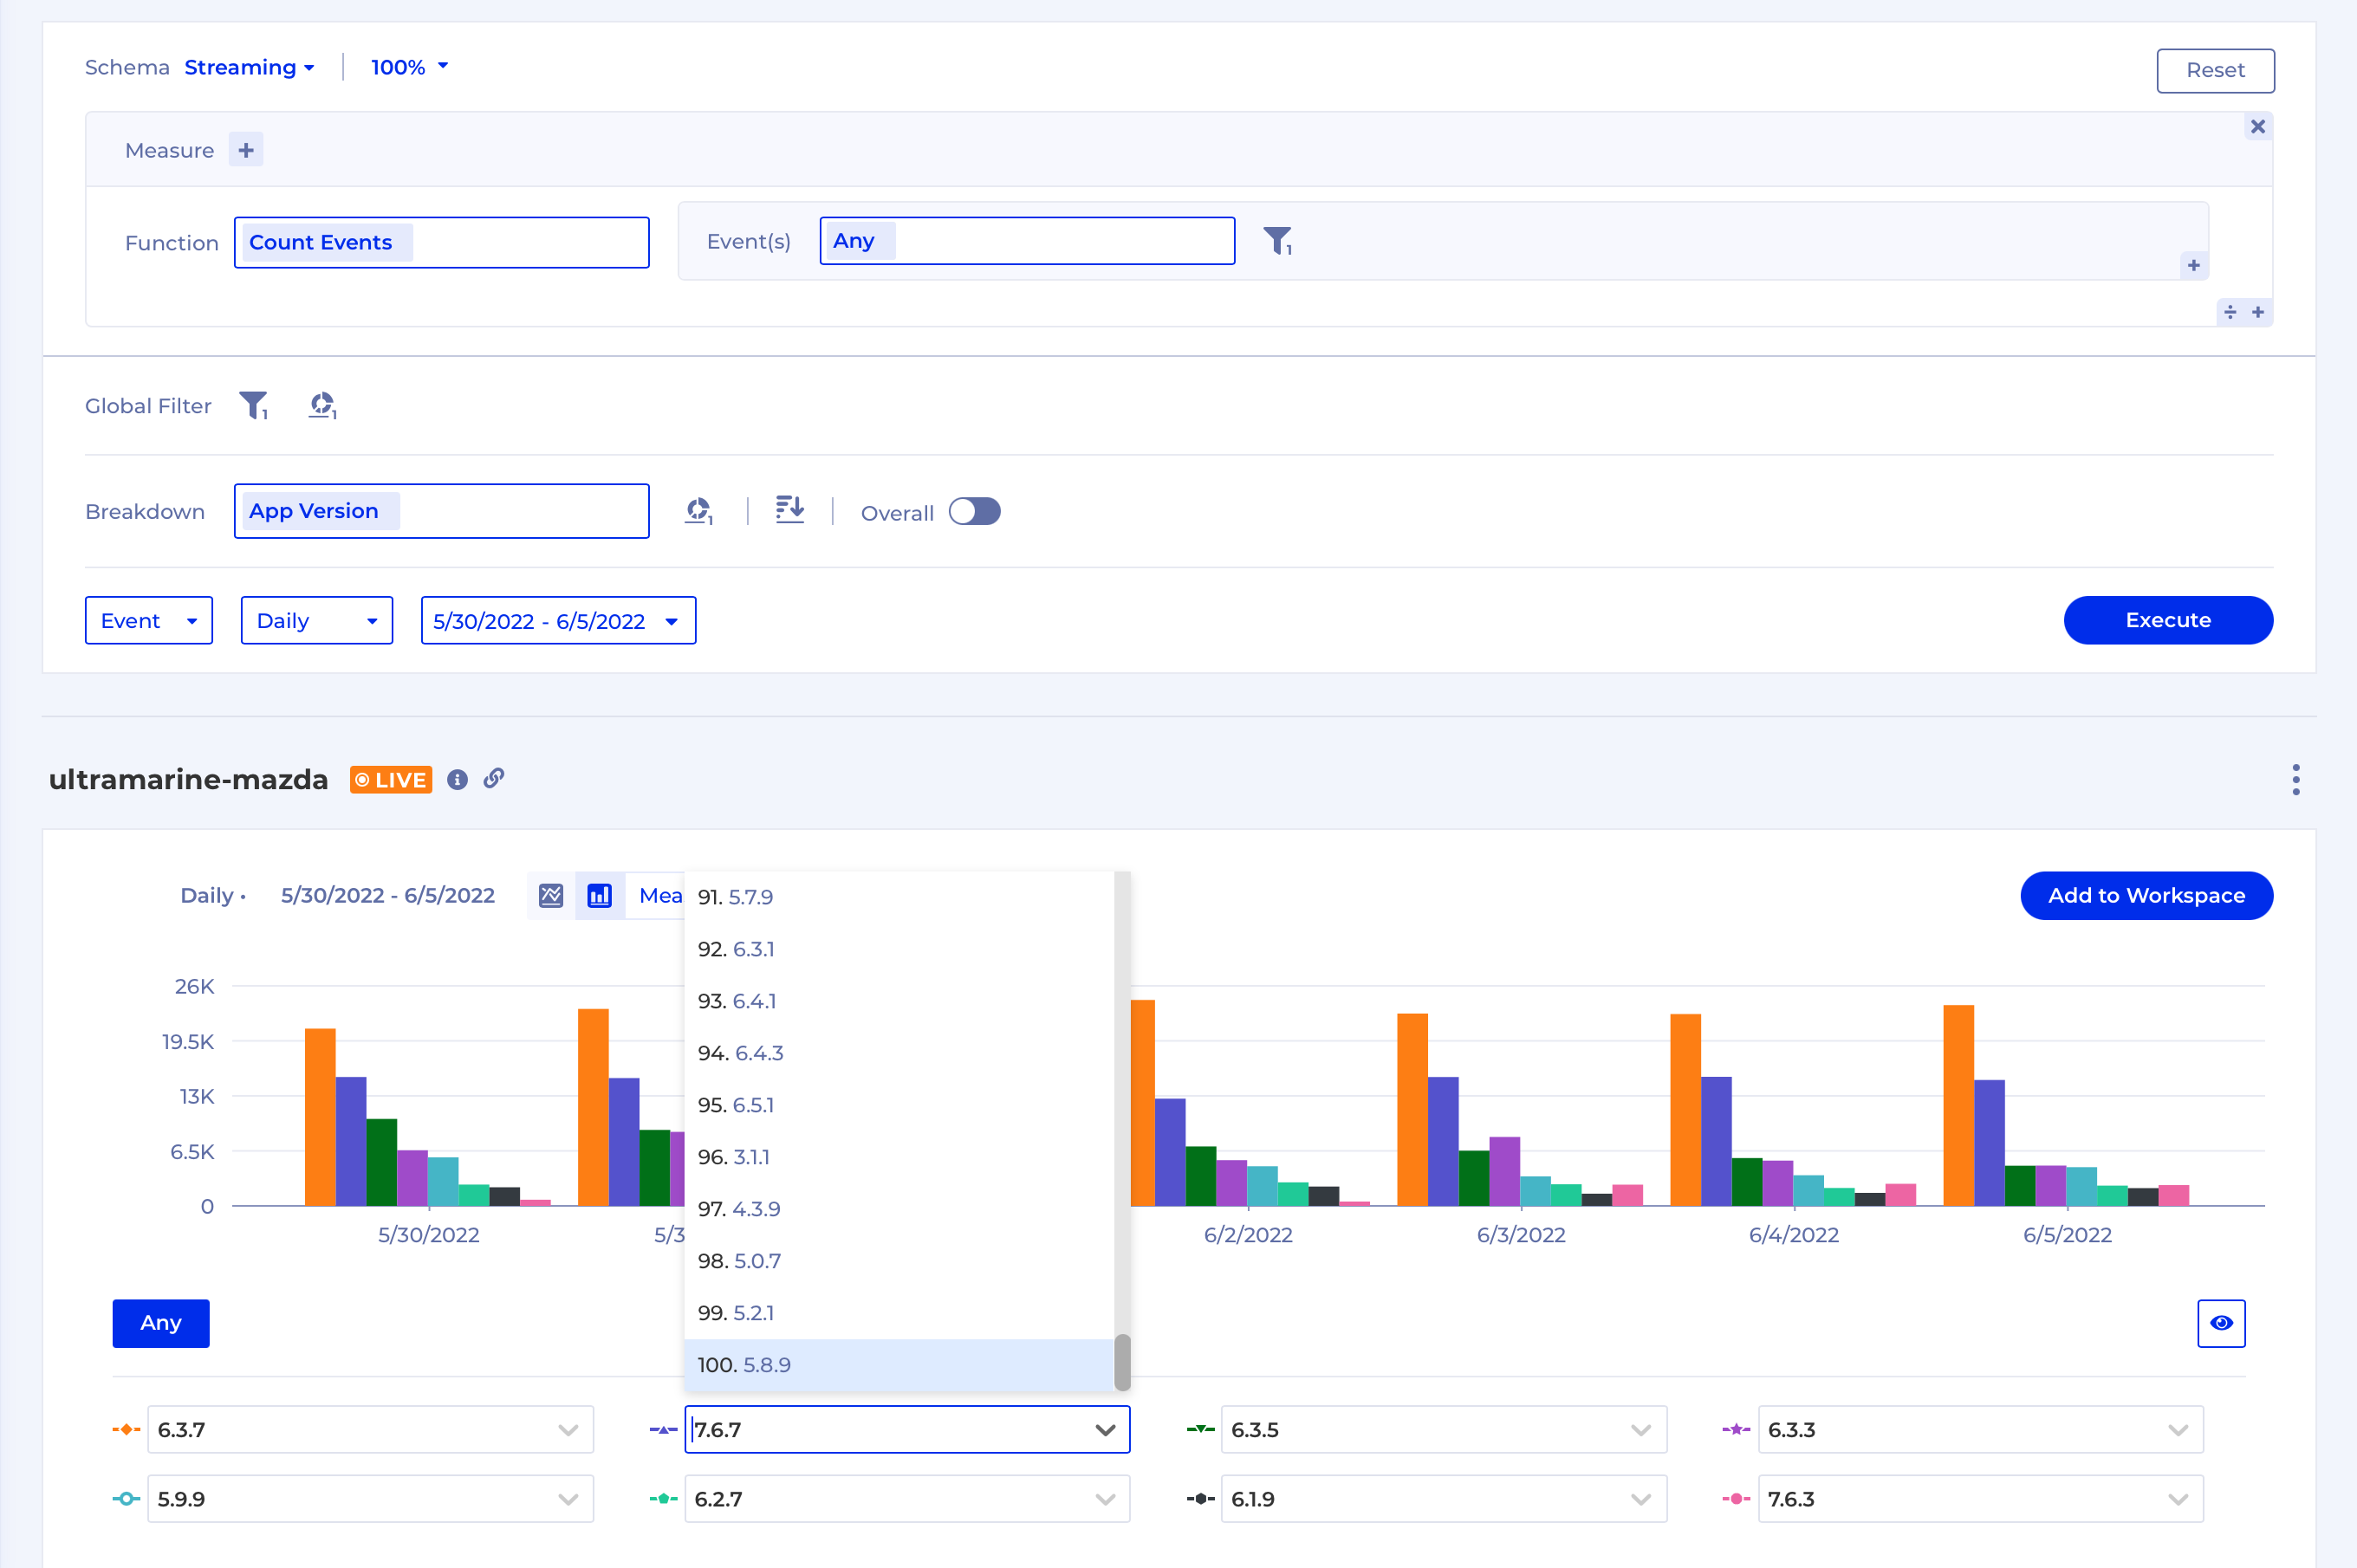
Increased the maximum Breakdown Groups available for selection on a Chart from 25 to 100
To give you more flexibility we now return up to 100 Breakdown Groups for every chart. UI still shows up to 8, but you can select any 8 from the top 100 as shown below:
Improved Retention date range input
We moved the date range input for the Retention so it's clearer what it controls. As you can see below, the input now sits with the Cohort which means this is the date range for the retention analysis starting cohorts. By default the retention time range is the same, but you can also extend it as shown below:
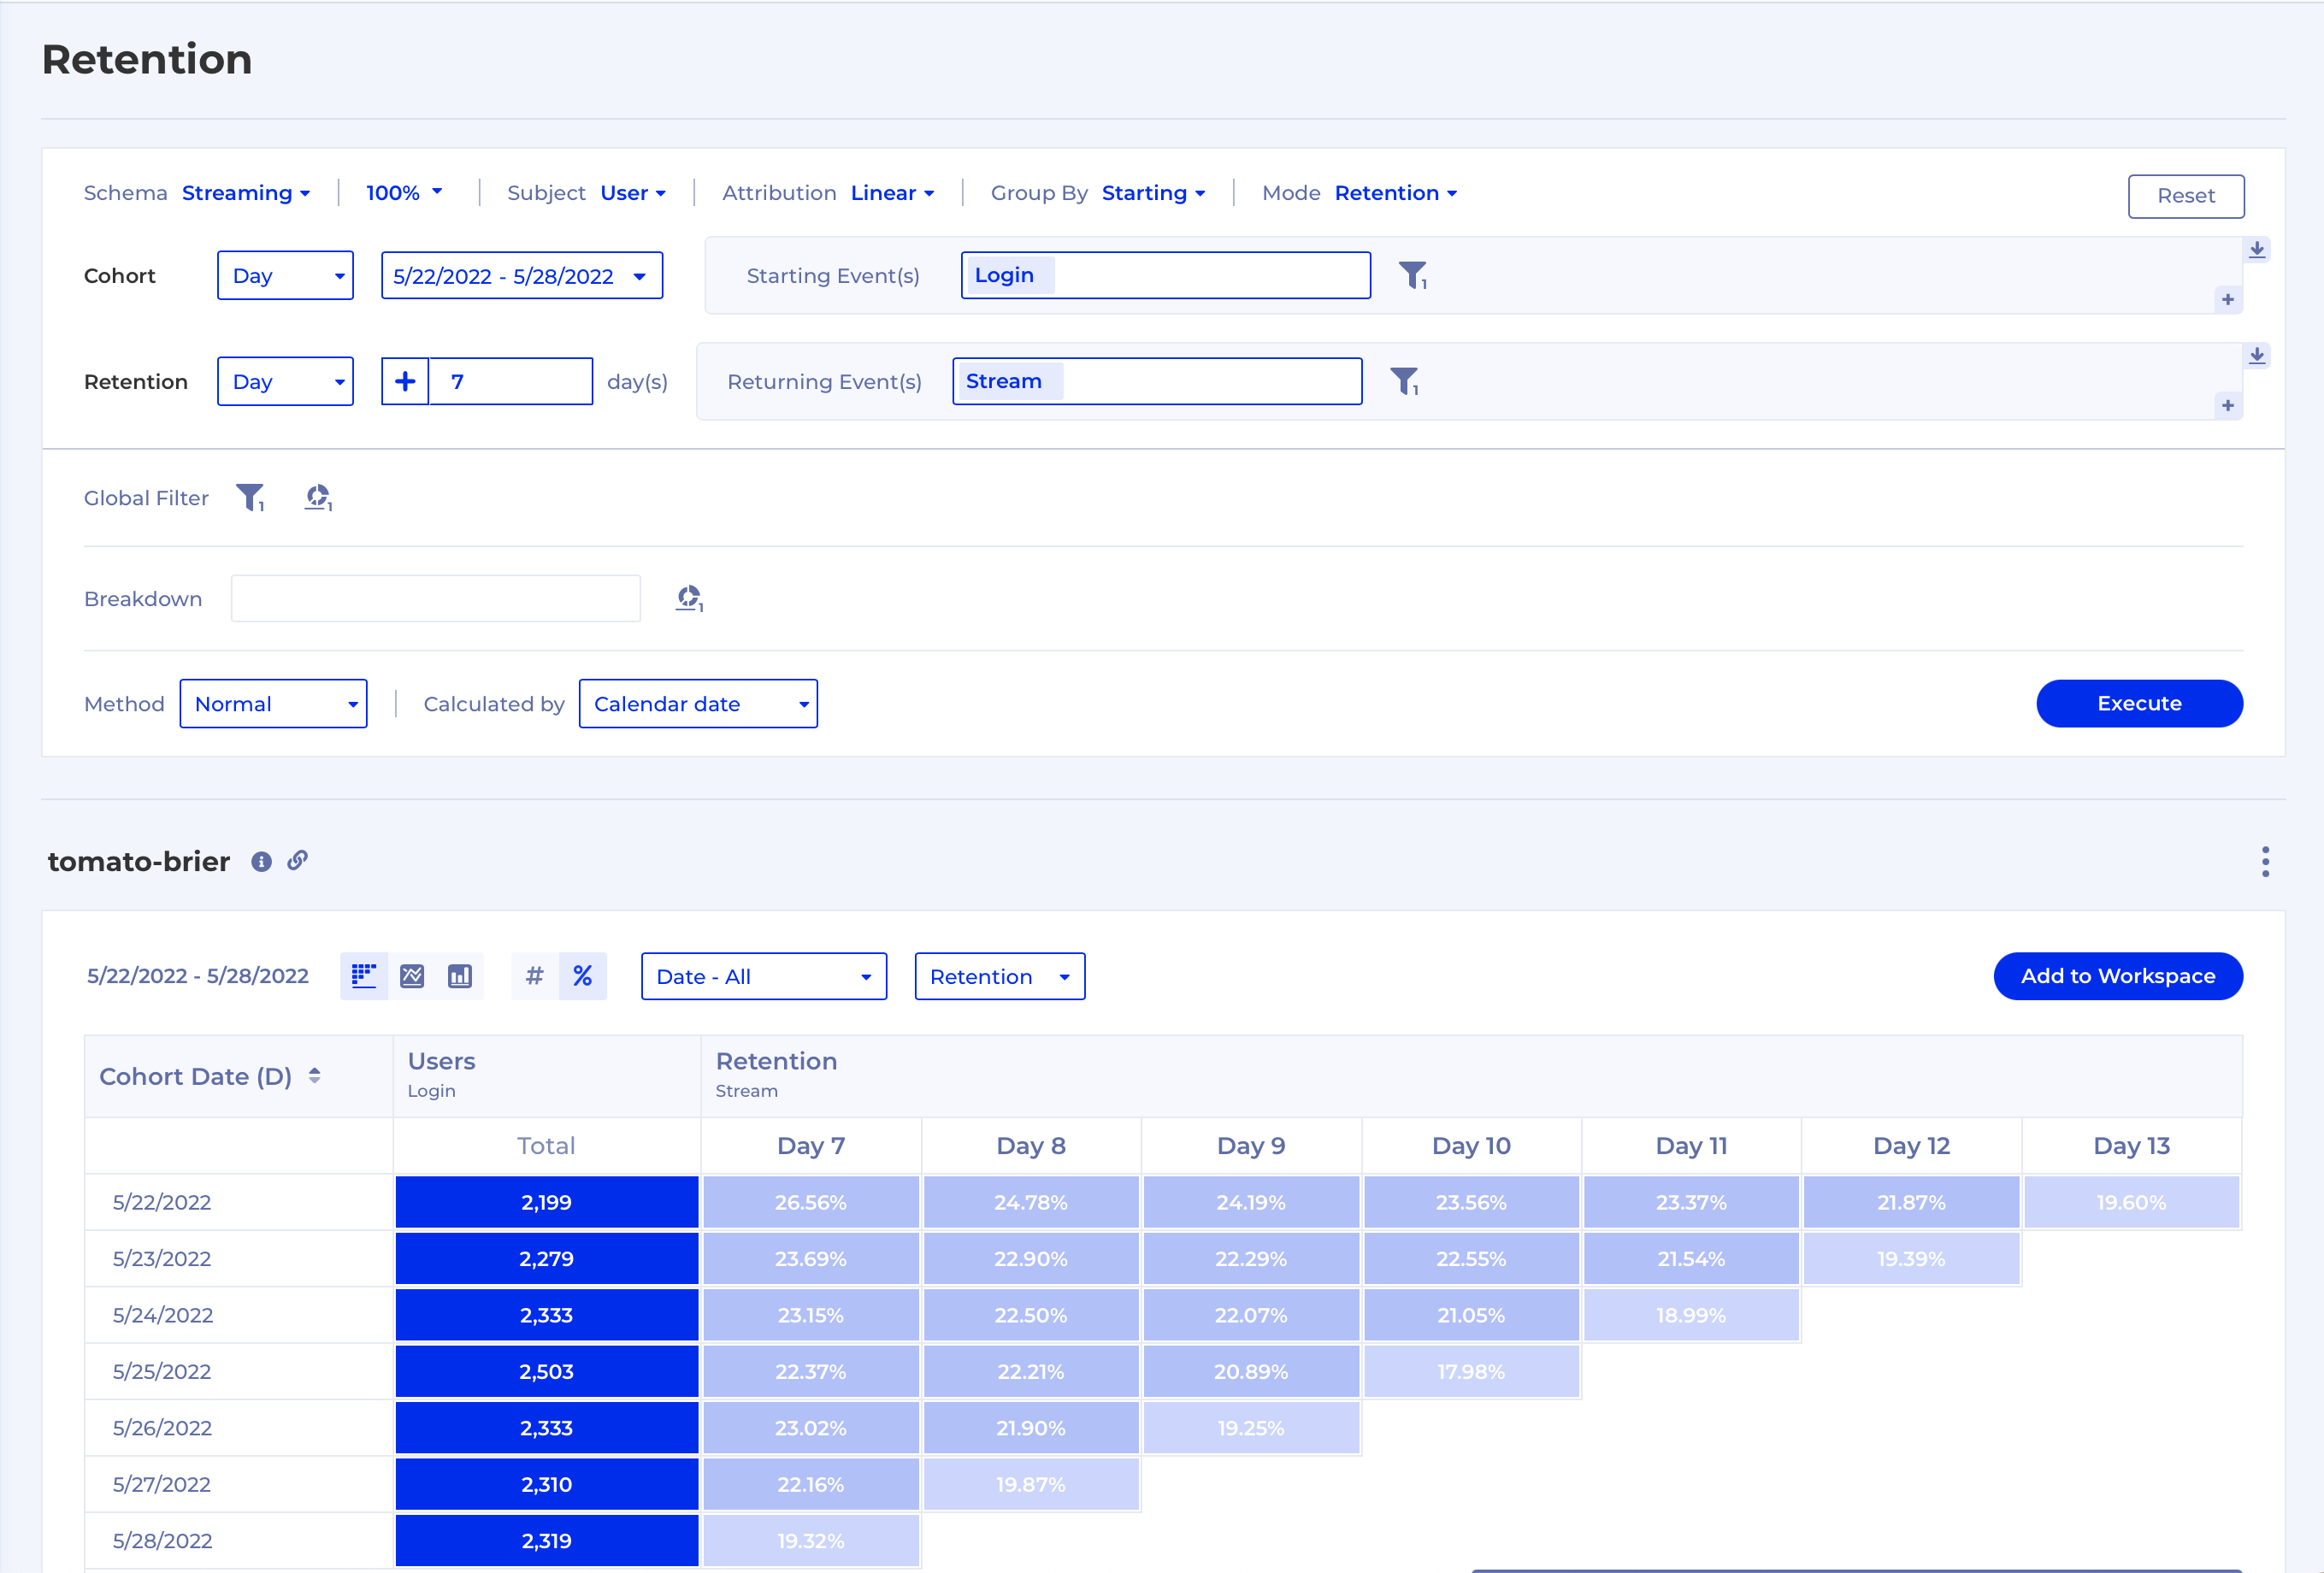
In this example we've told Kubit that for the date range [5/22/2022 - 5/28/2022] we want to define a Cohort for each day. Then we want to measure how each of these Cohorts retains over time for the period [5/22/2022 - 5/28/2022] + 7 which is effectively [5/22/2022 - 6/4/2022].
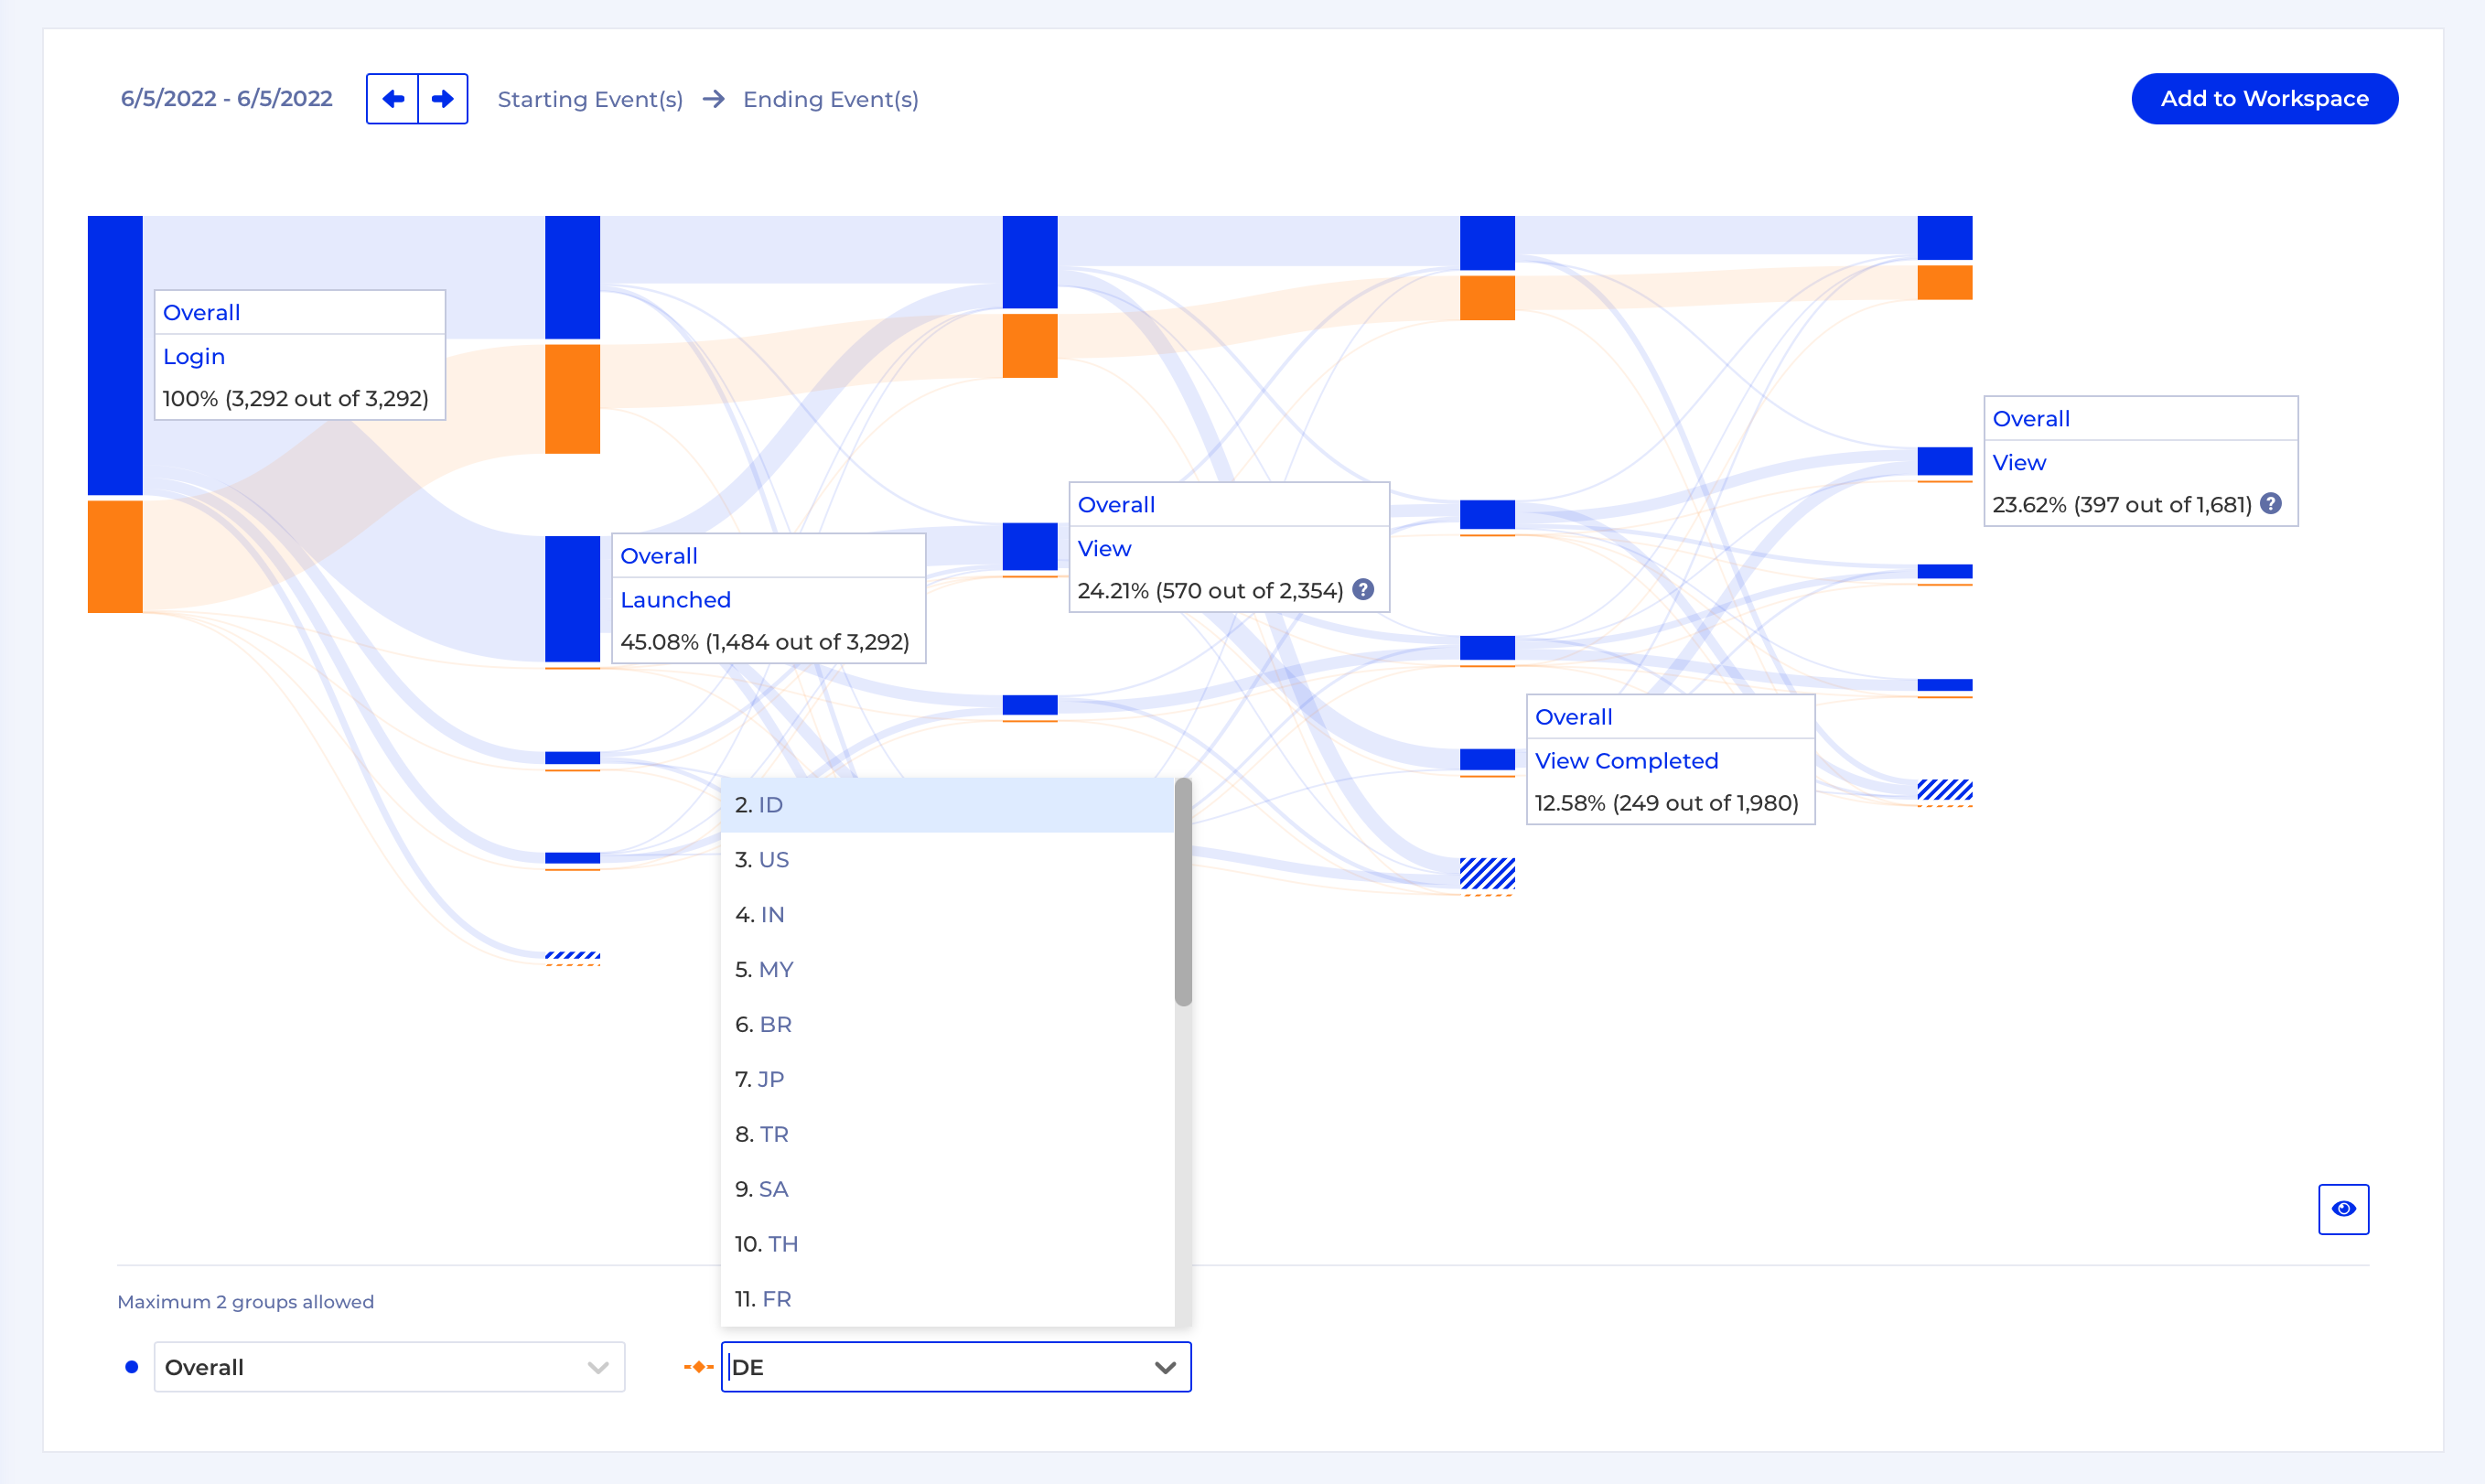
Added Overall option for Paths with a Breakdown
Overall option for Paths with a BreakdownNow when you're doing a Breakdown in a Path you can compare the group of users you're interested in with the total. To do that when you specify your Breakdown Property, e.g. Country, you need to turn the Overall toggle to the ON position like this:
Then in the resulting chart you can compare any 2 groups against each other, including the Overall: