R293 - 2023-04-06
- Added features
- New Retention modes:
- Retention Over Time
- Usage Interval
- Usage Interval Over Time
- Dashboard Filters
- New Retention modes:
- Improved
- Schedule
- Dashboard Numeric panel
- Removed
- Formatting options in Query builder
New Retention modes
User retention is the number of users who continue interacting with your product over a given period. But underneath the surface there's more to explore:
- how does a significant event (e.g. new feature released) impact retention?
- how often do users interact with your product or a particular feature of the product?
- how does the time between interactions with a particular feature change over time?
With the new Retention Modes Kubit helps you to answer those questions and obtain a deeper understanding of user retention and churn. You can find them here:
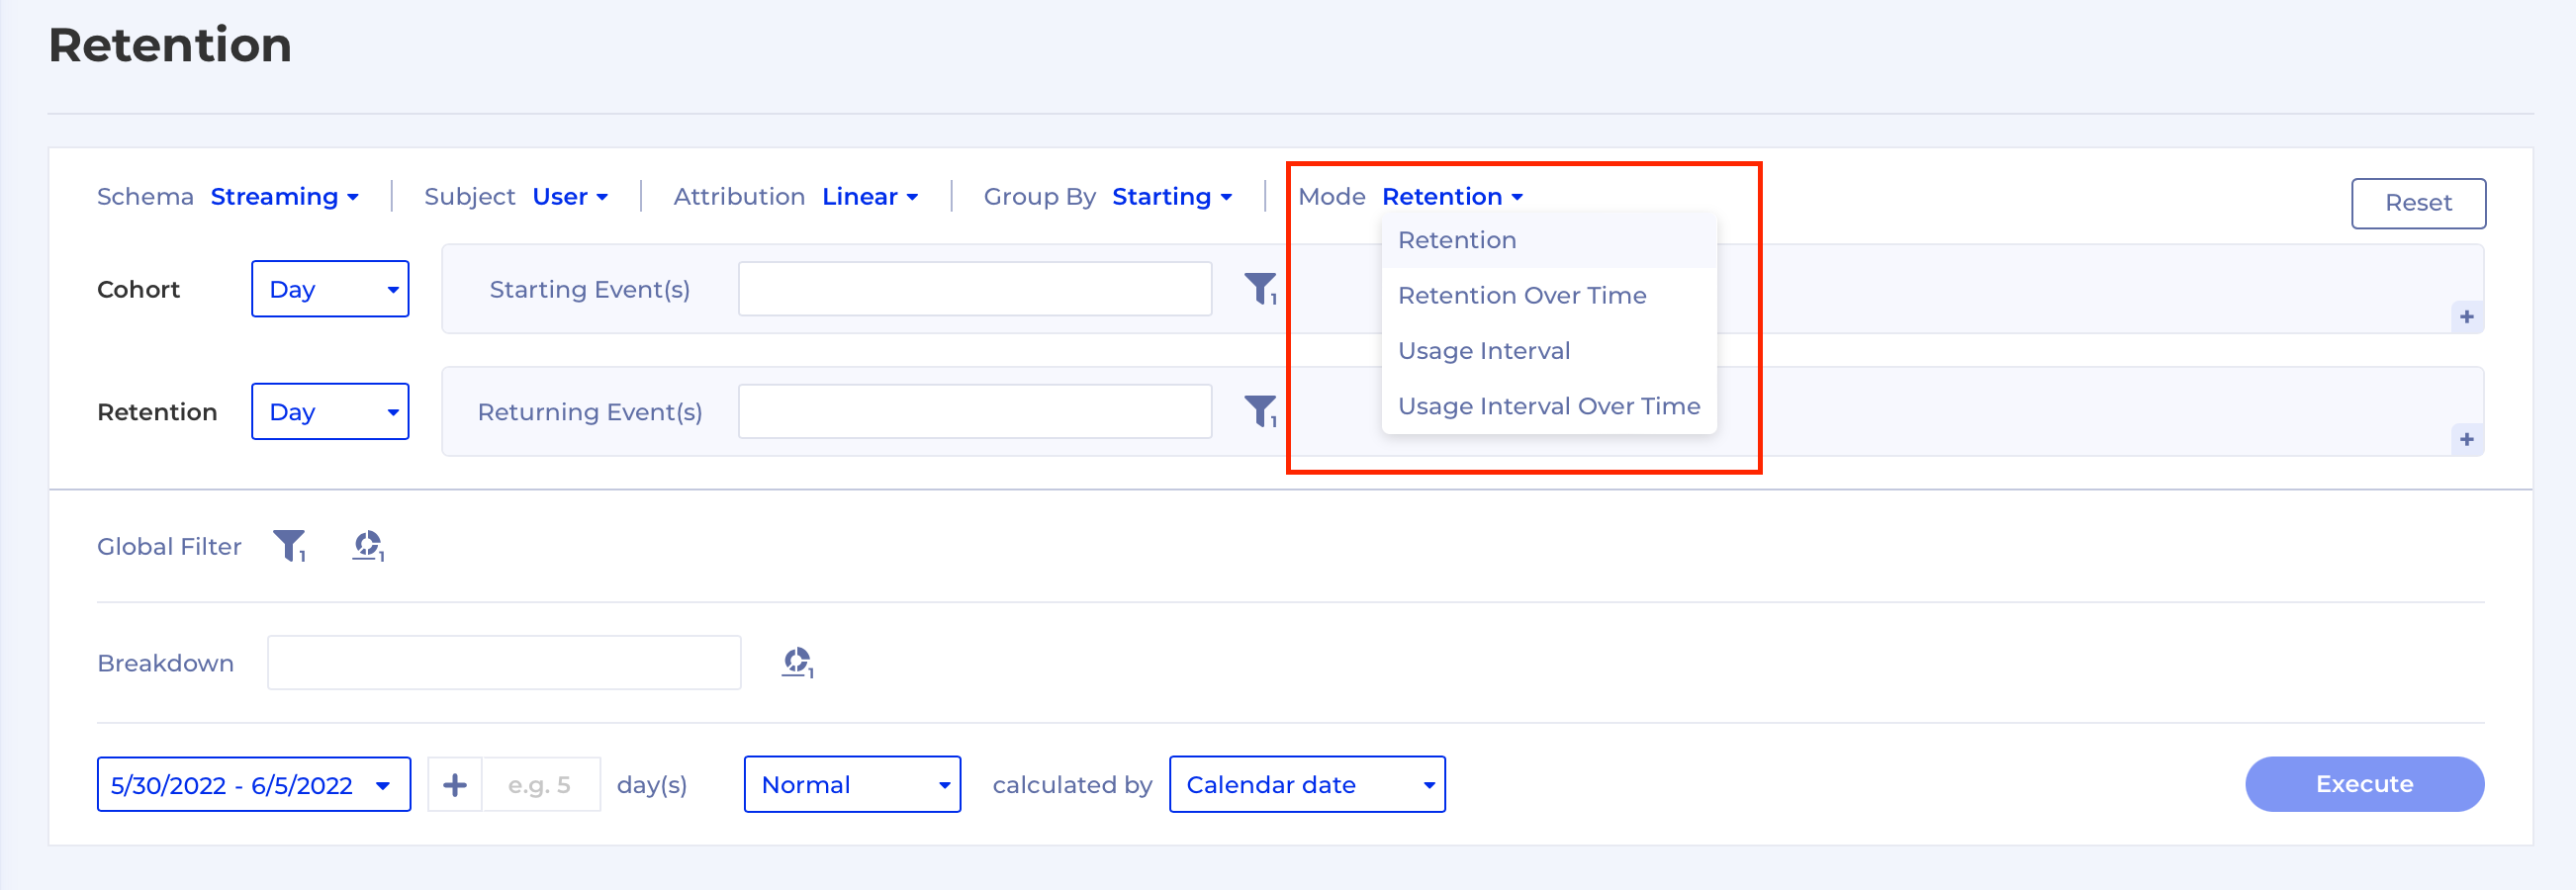
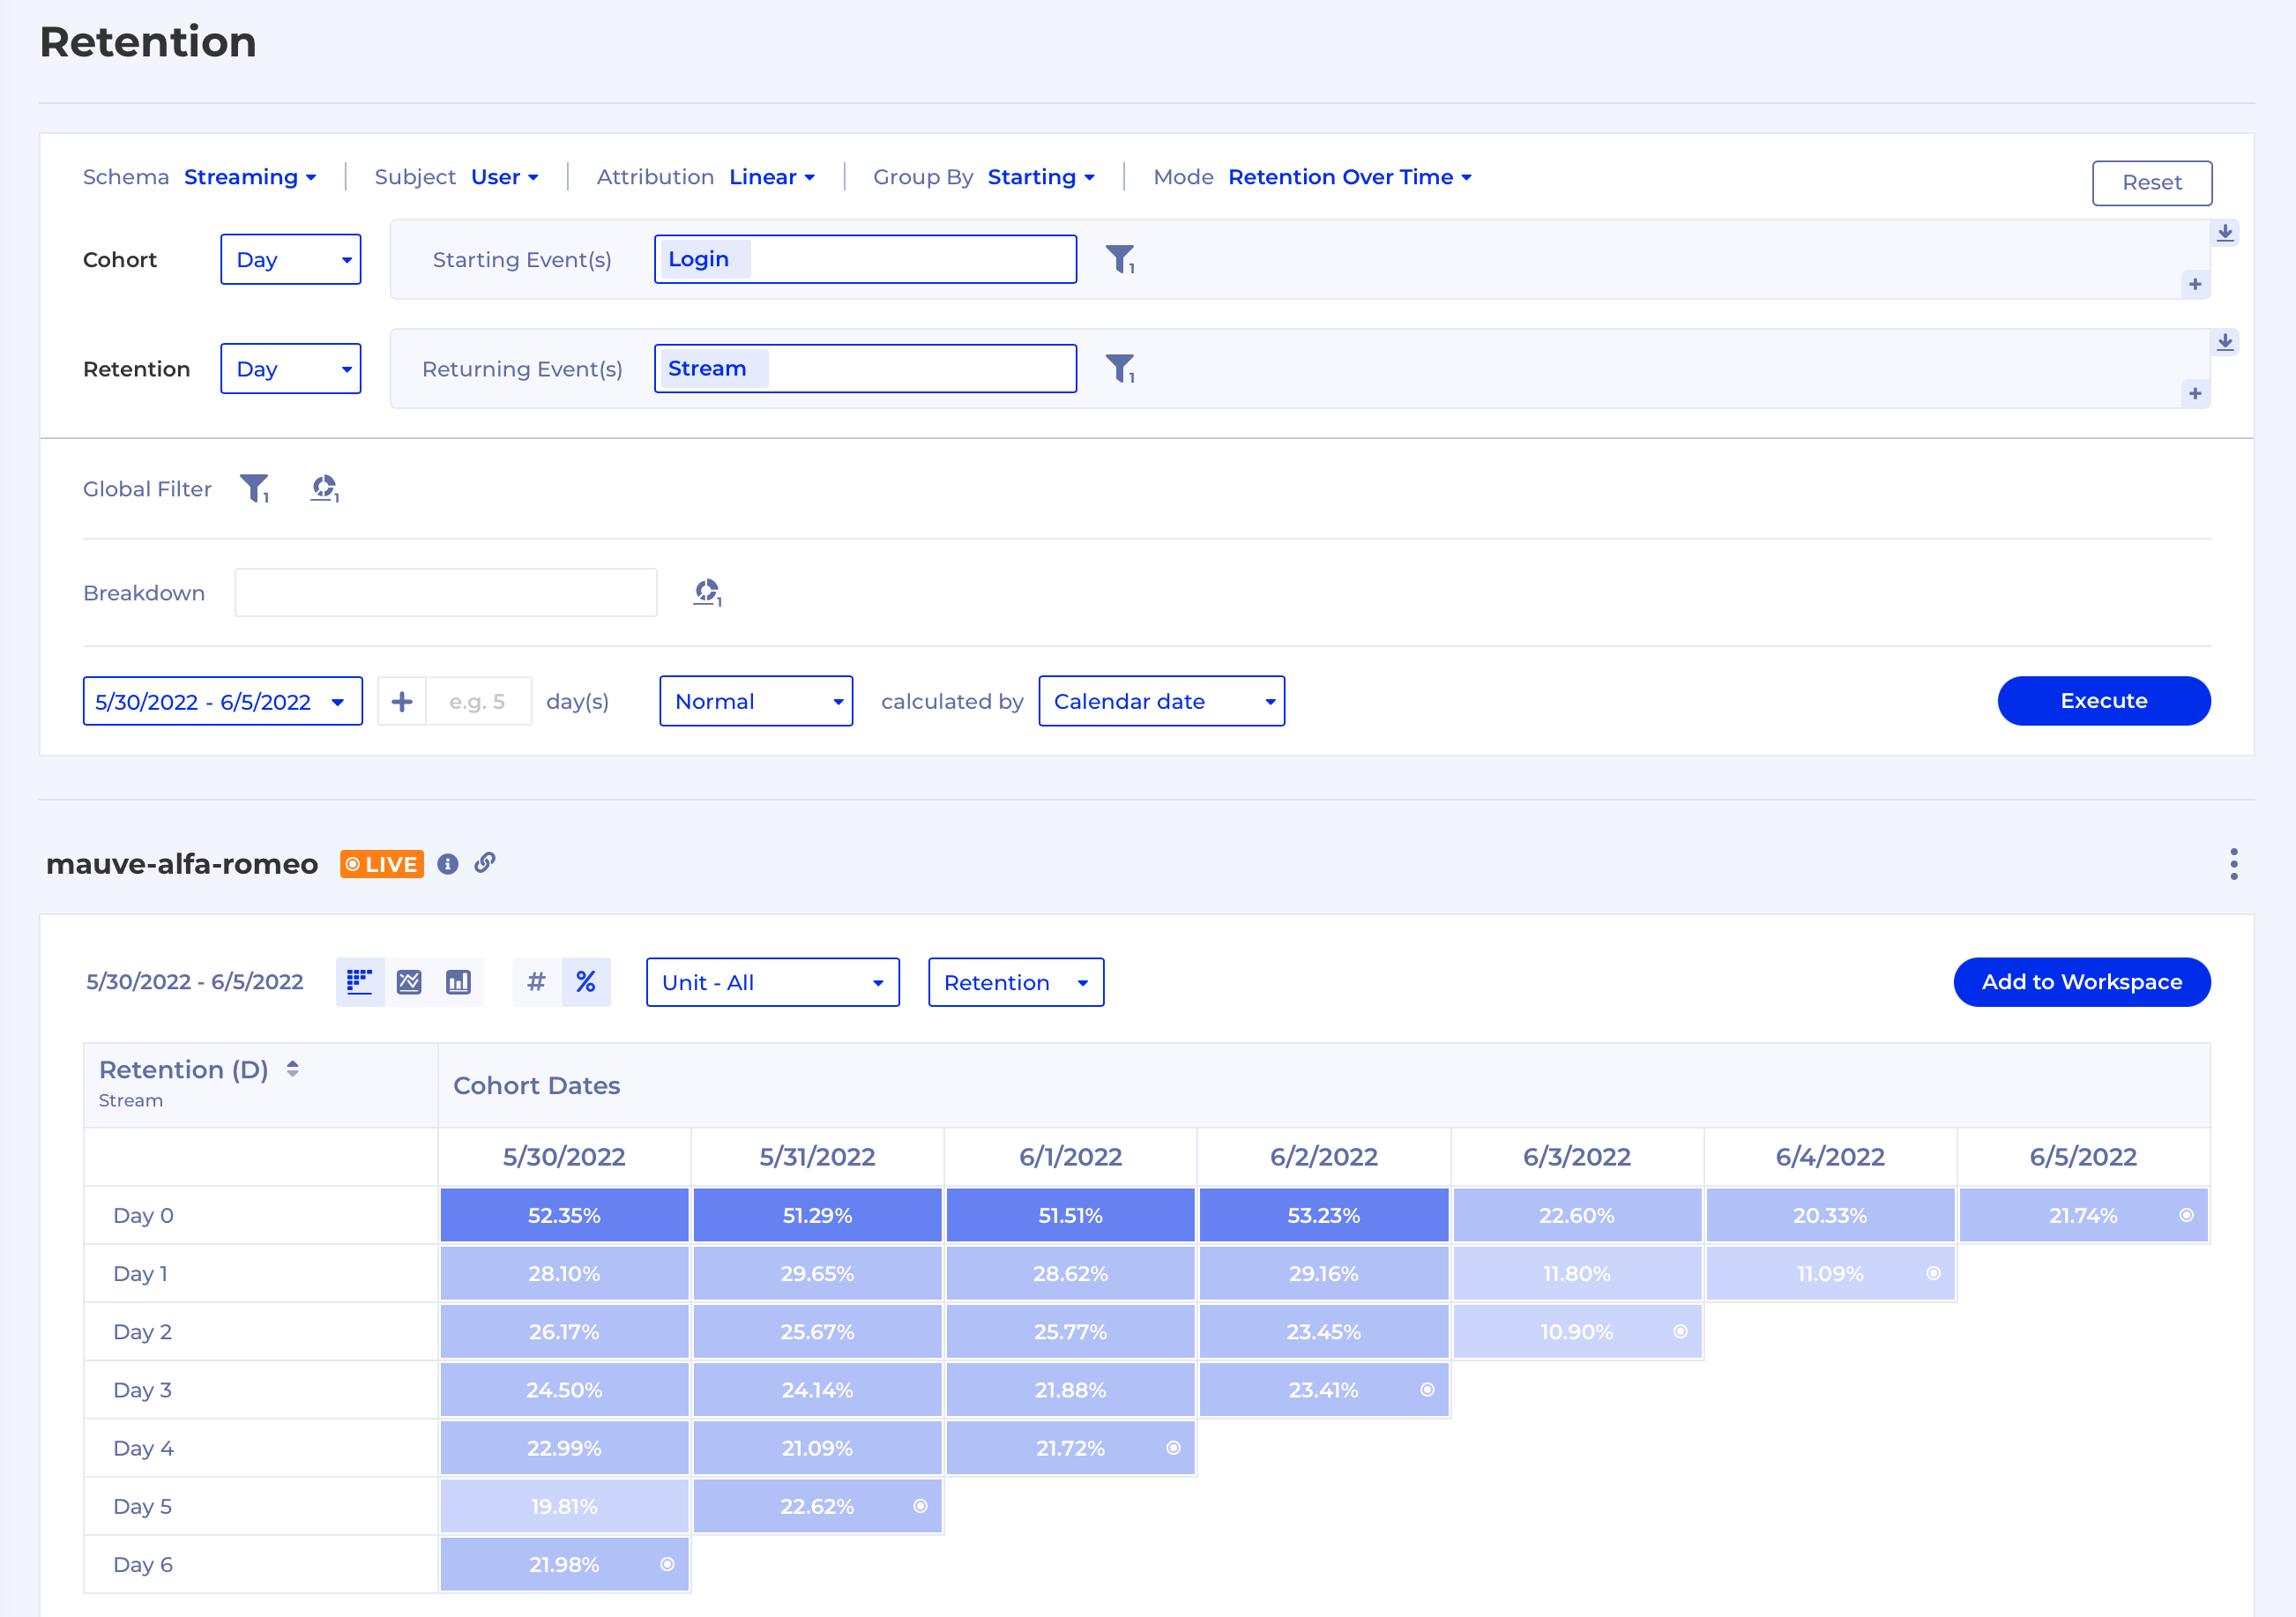
Retention Over Time
Sometimes a new release can have an impact on retention rates on a particular day. In this case you may want to focus on what the retention is on Day X so you can use Retention Over Time which displays the same data as Retention but with reversed axes (the X-axis is switched with the Y-axis).
Usage Interval
With this mode you can find what's the typical Usage Interval of a product feature, e.g. Login. The chart below shows you what % of users have generated the returning event by Day X.
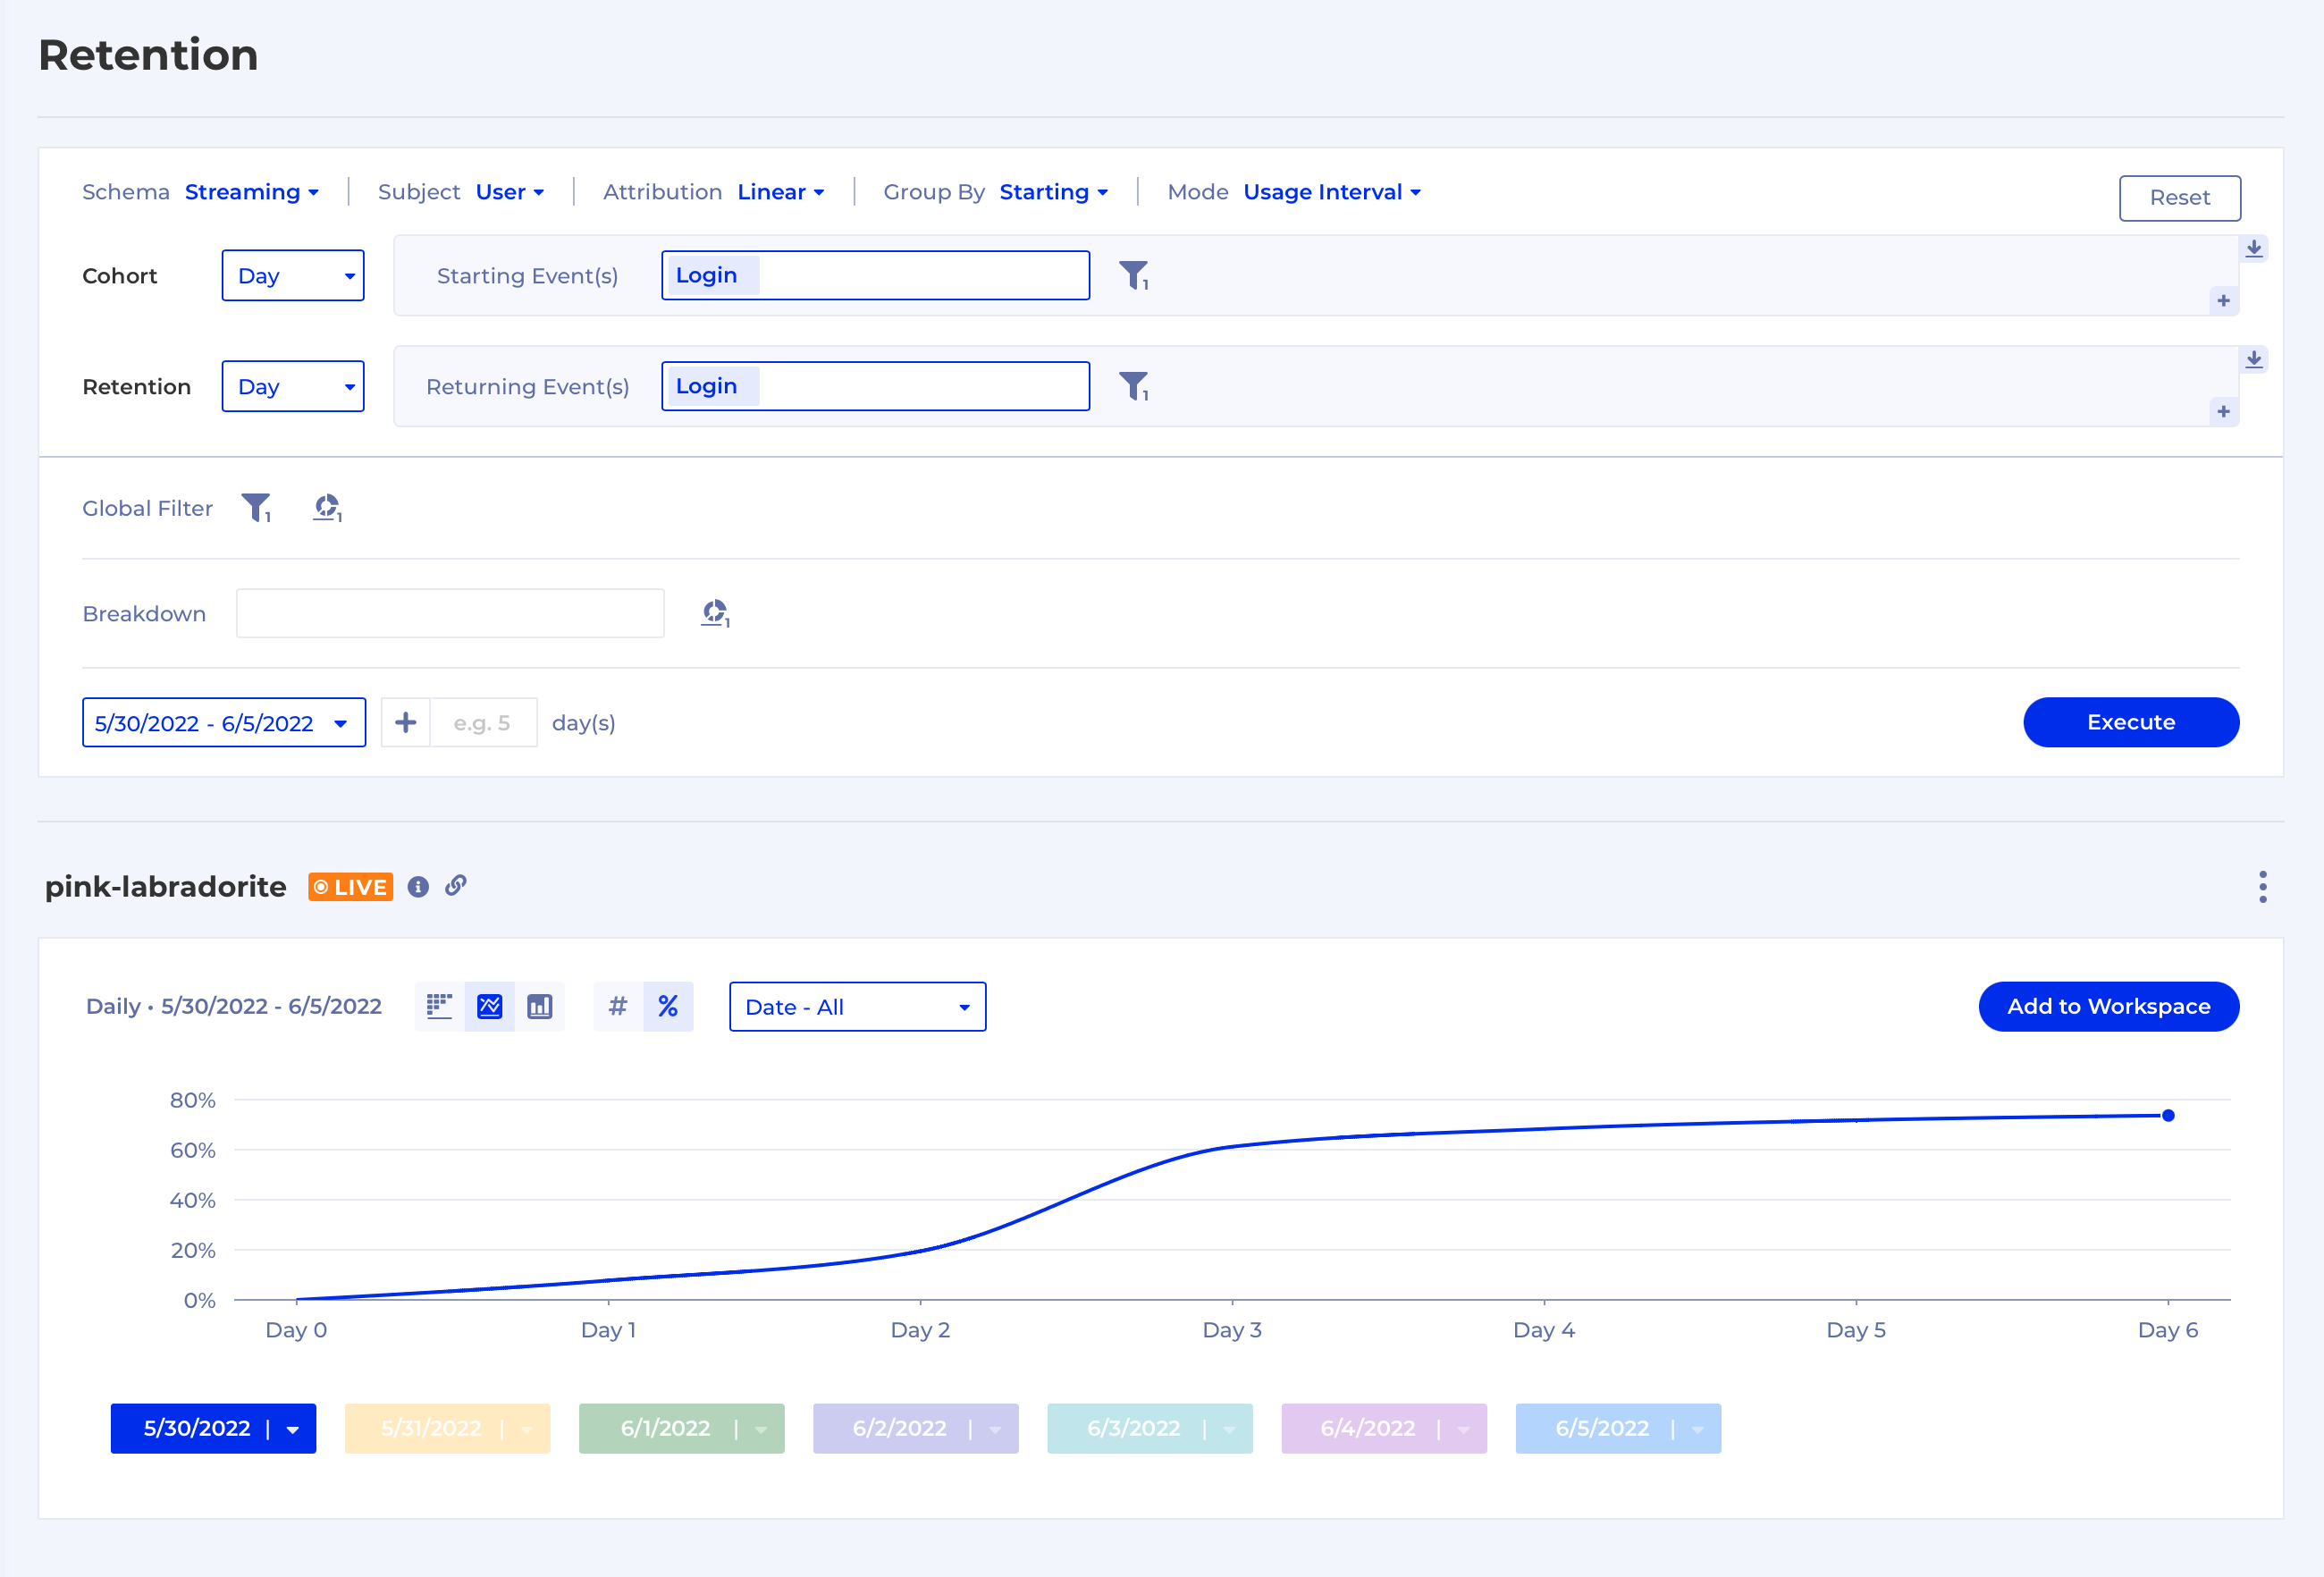
NoteOver time the % will always be more or equal to the one on the previous Day.
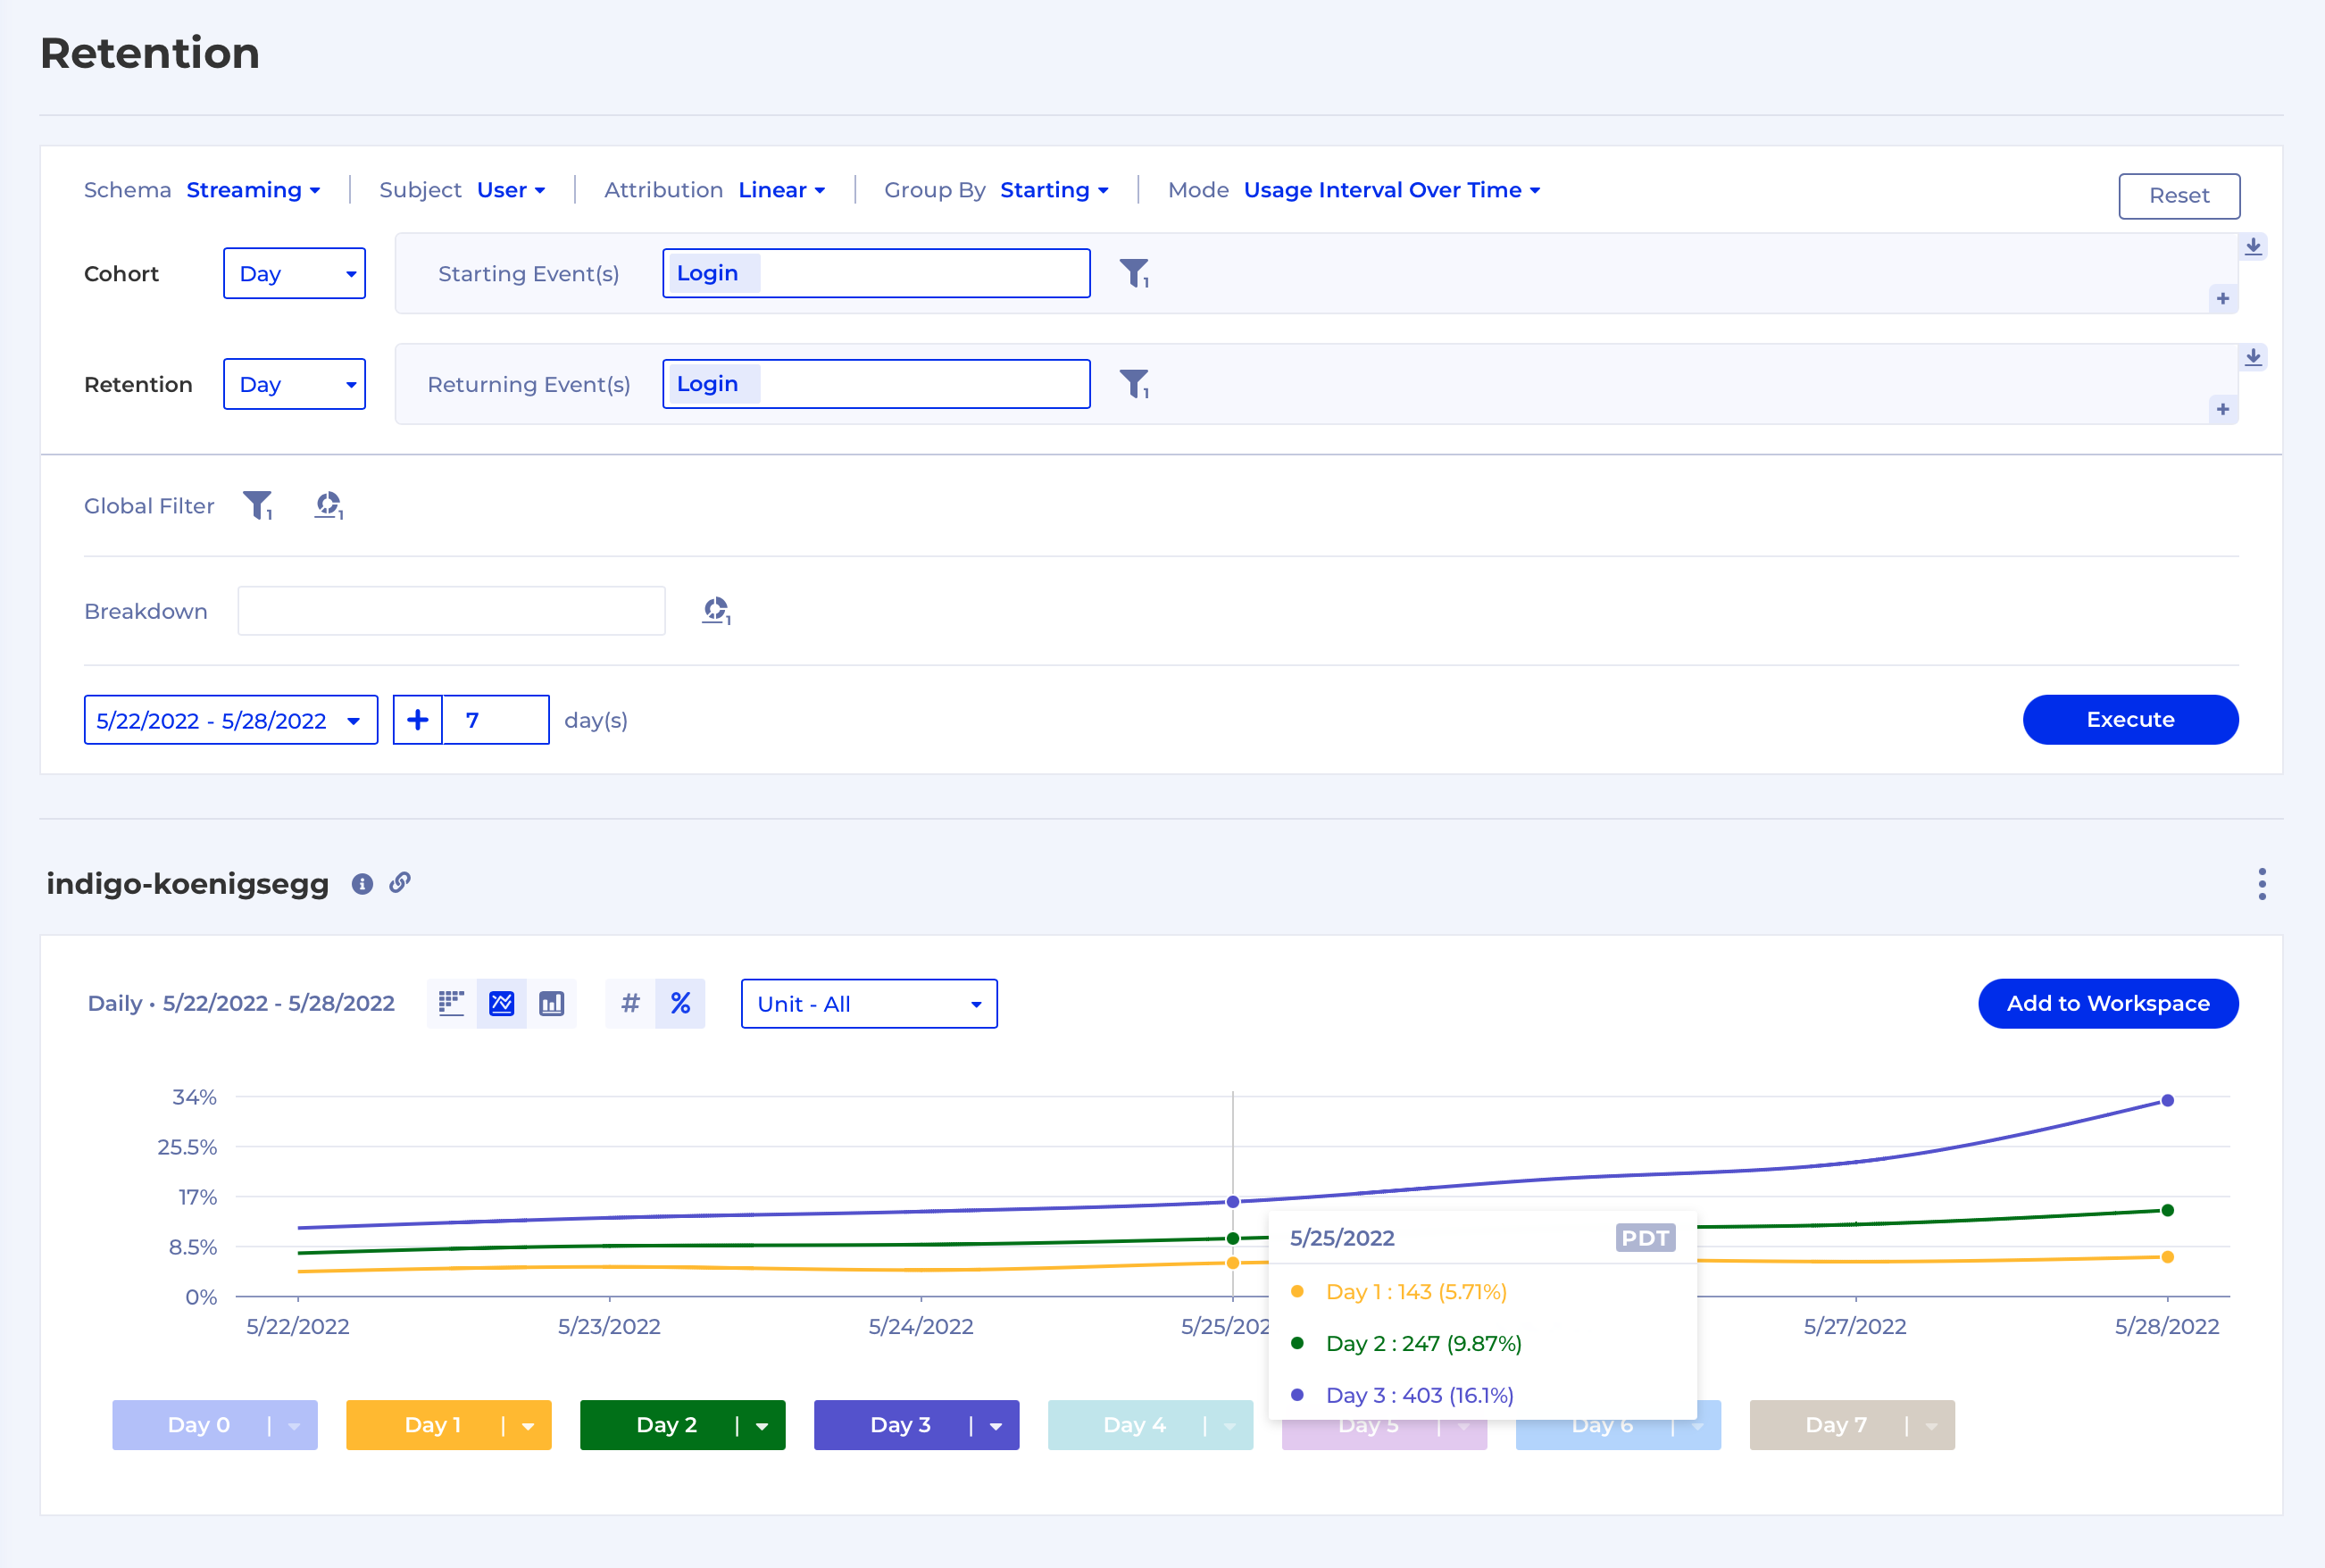
Usage Interval Over Time
Usage Interval Over Time which displays the same data as Usage Interval but with reversed axes (the X-axis is switched with the Y-axis), so you can literally see how the Usage Interval of an event changes over time.
Dashboard Filters
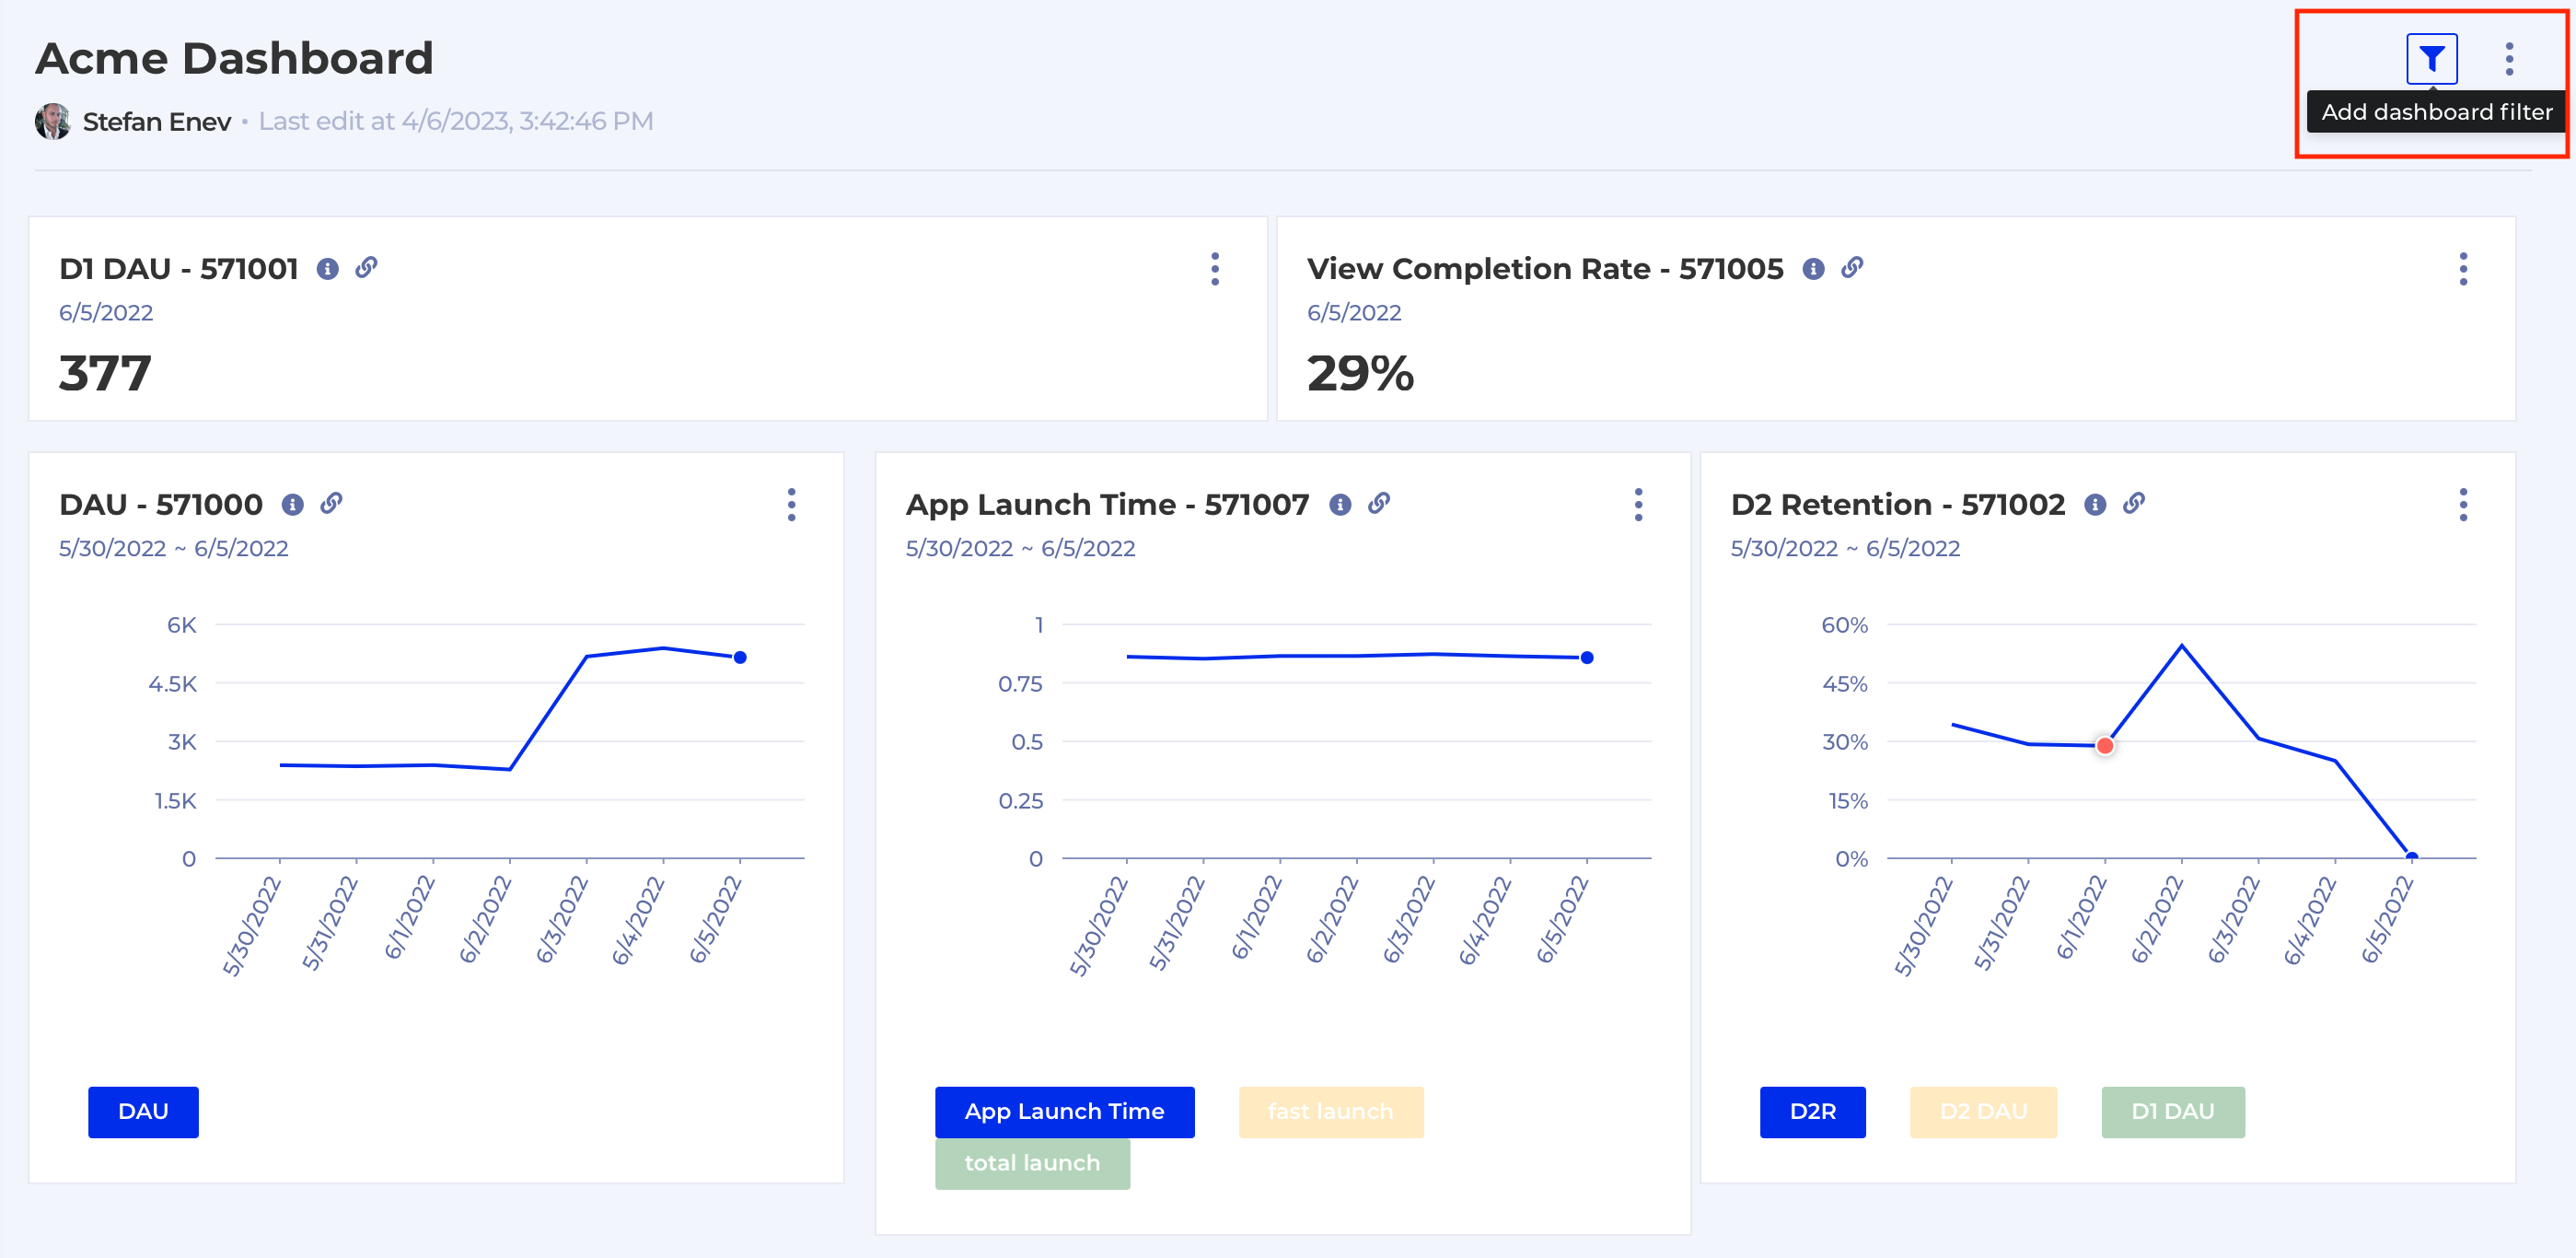
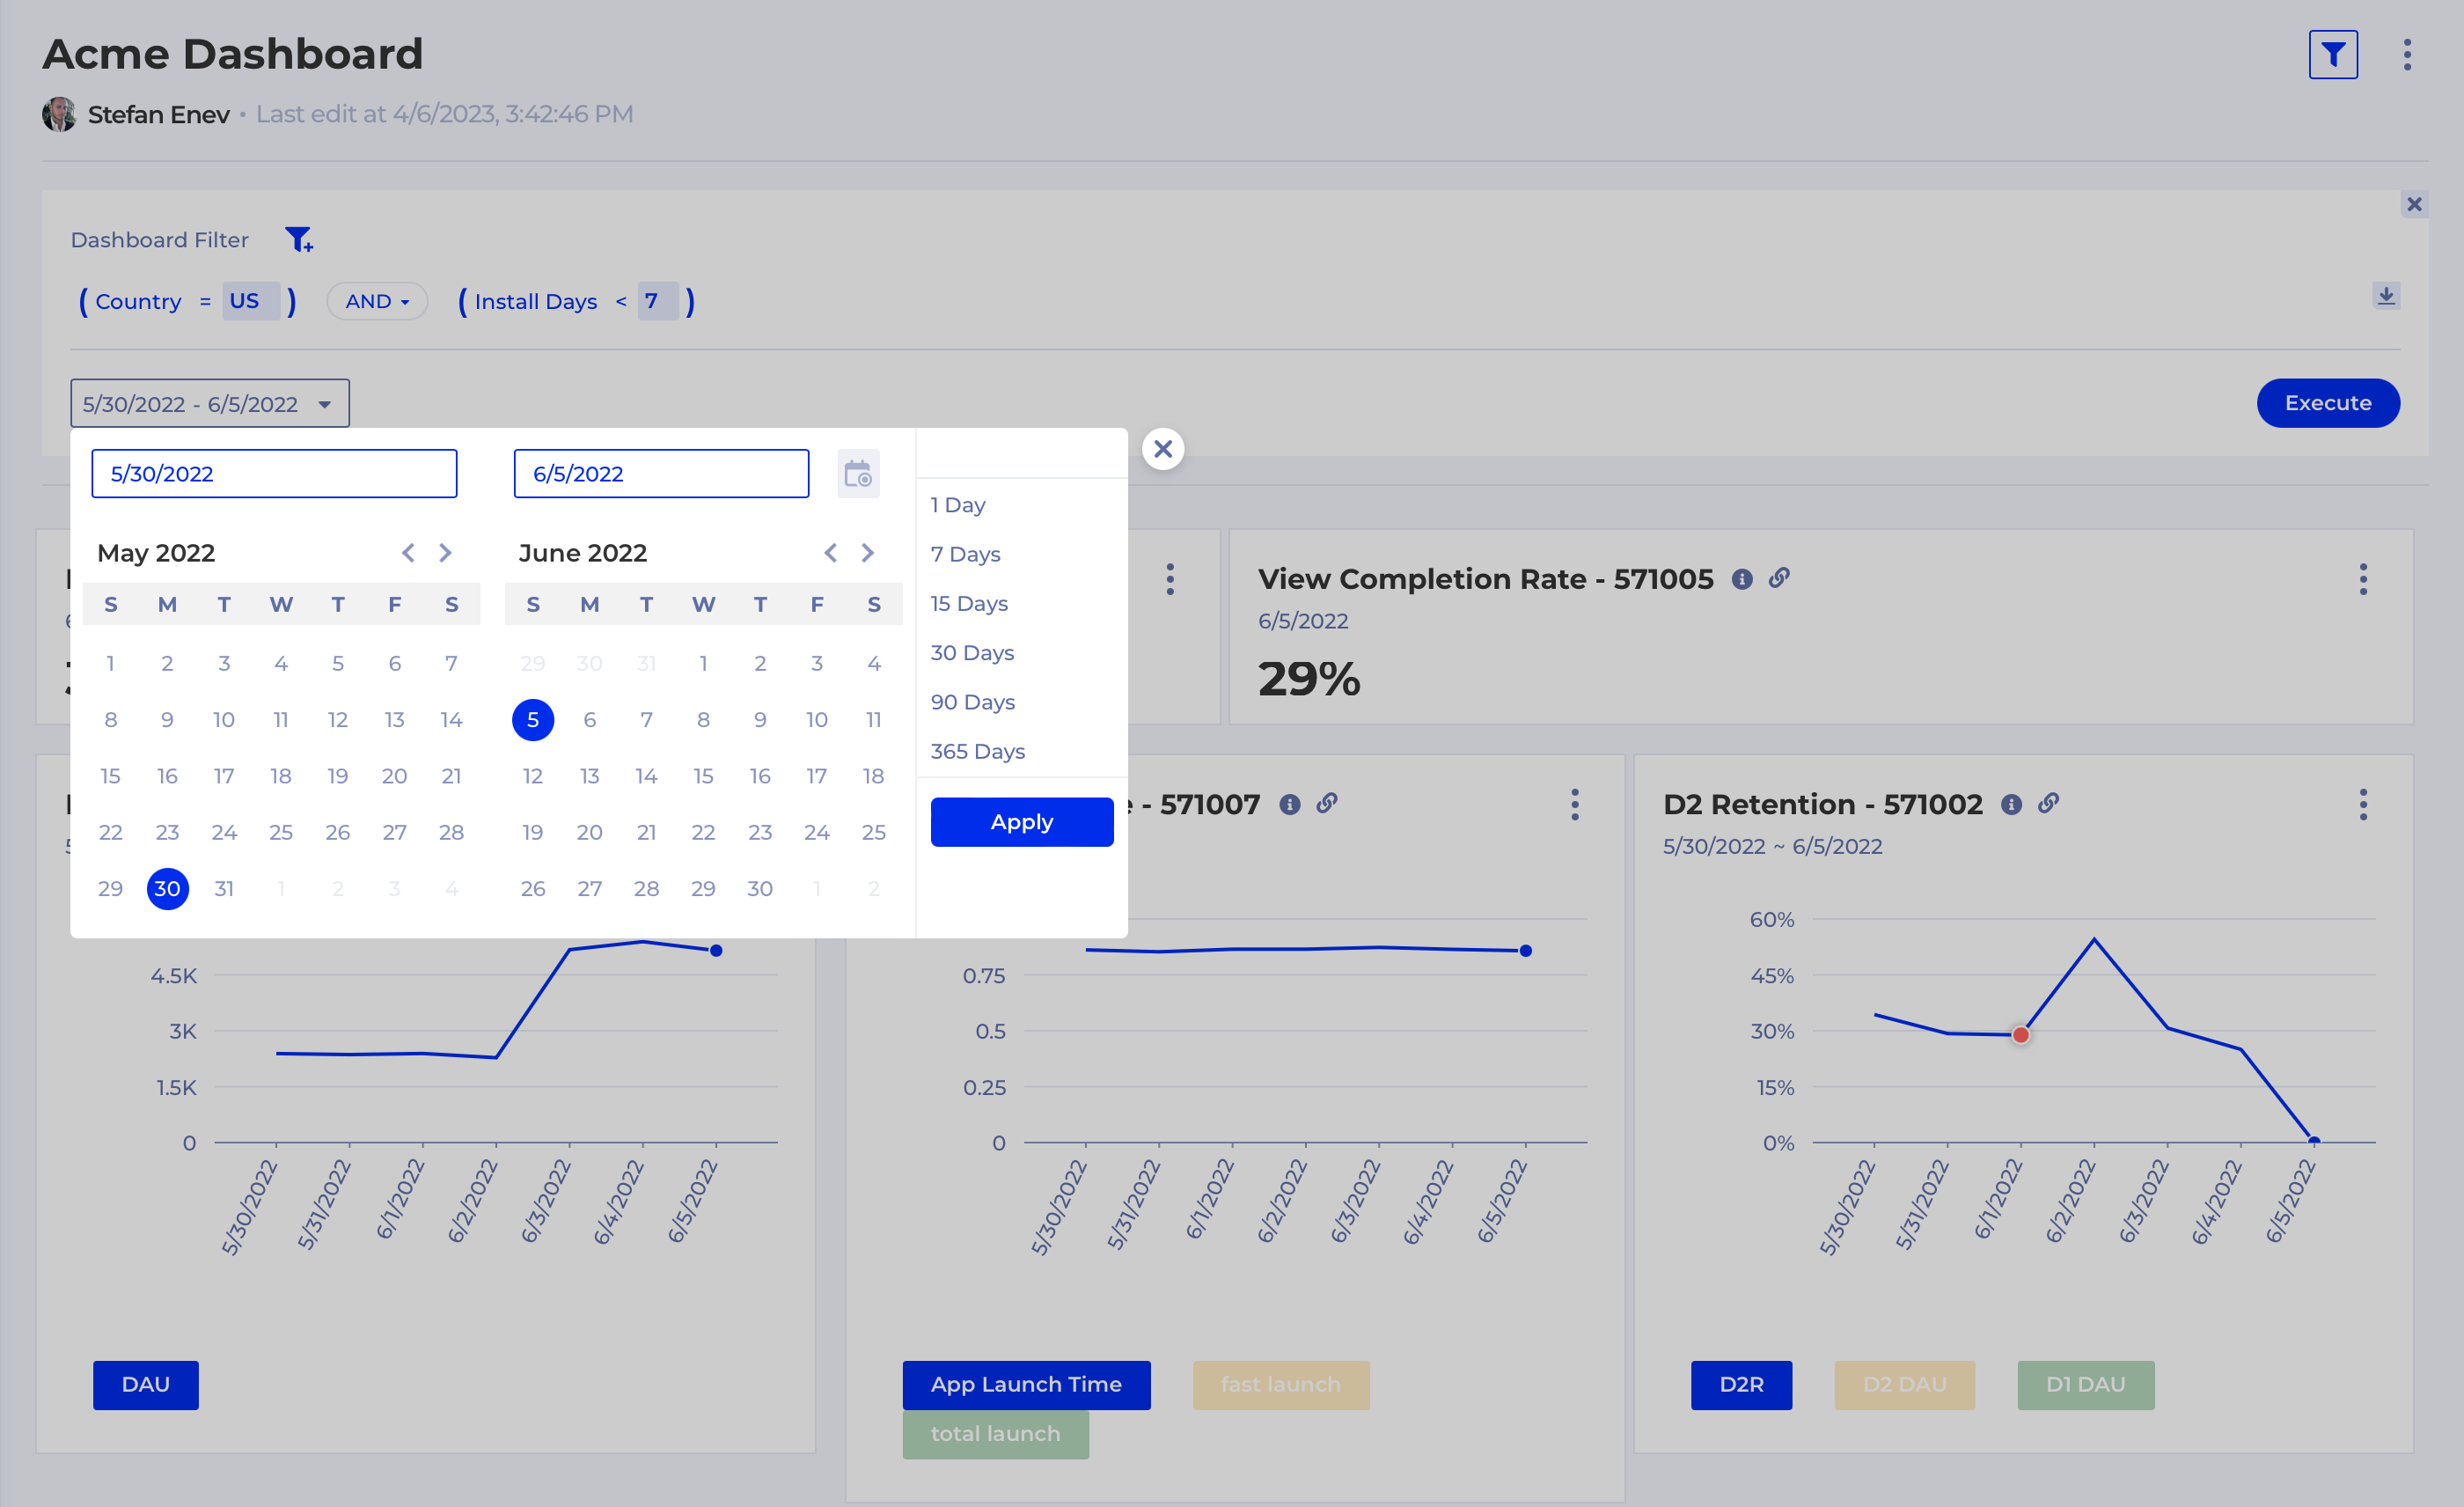
To give you even more flexibility to find your insights Kubit now provides you with the option to apply Filters over a whole Dashboard in just a few simple steps. To get started you need to open a Dashboard and click on the Add Dashboard Filter icon on the top right and then you can apply multiple filters, change the date range or both. Remember to hit Execute in the end.
With great power come a few limitations
- once filter/date range is modified you cannot change the Dashboard layout or create a Schedule for the modified Dashboard
- this feature is disabled when a Dashboard contains charts from multiple Schemas
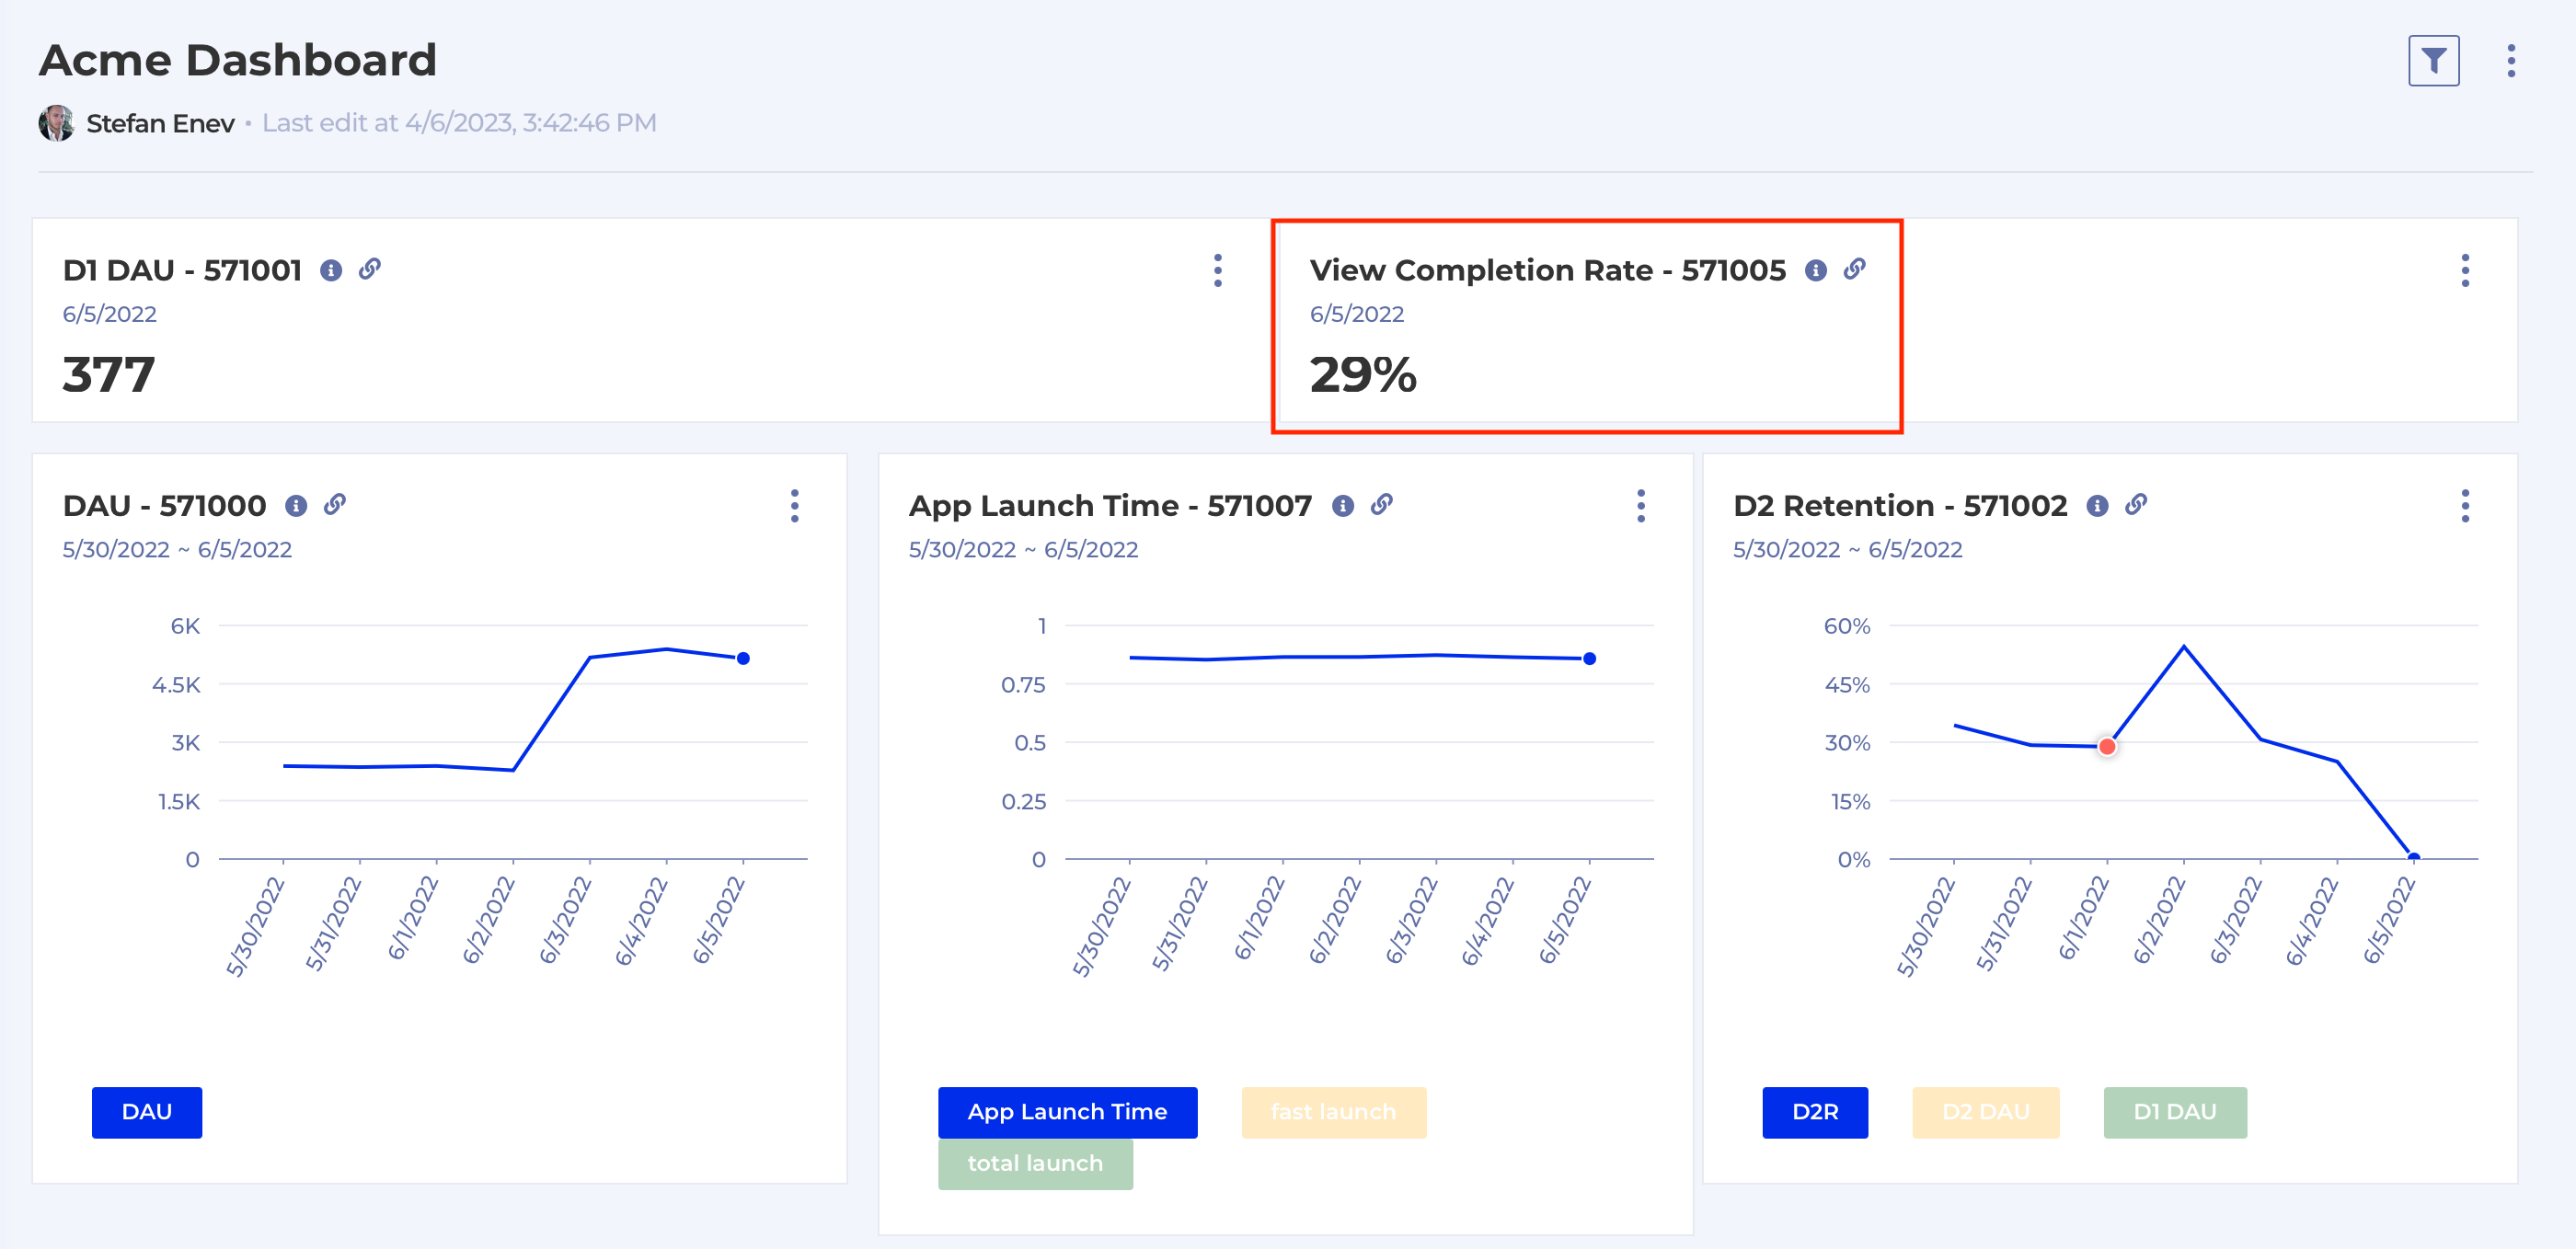
Dashboard Numeric panel
When you create a Numeric panel from a Measure on a Dashboard the formatting of the Measure is now preserved. This means you can now control:
- whether to display the measure as a number (#), percentage (%) or money amount ($)
- how many digits to display after the decimal point
Schedule improvement
When you're creating a Schedule you can select the Execution Time from a list of suggested options, or you can now type in whatever time you fancy like this:
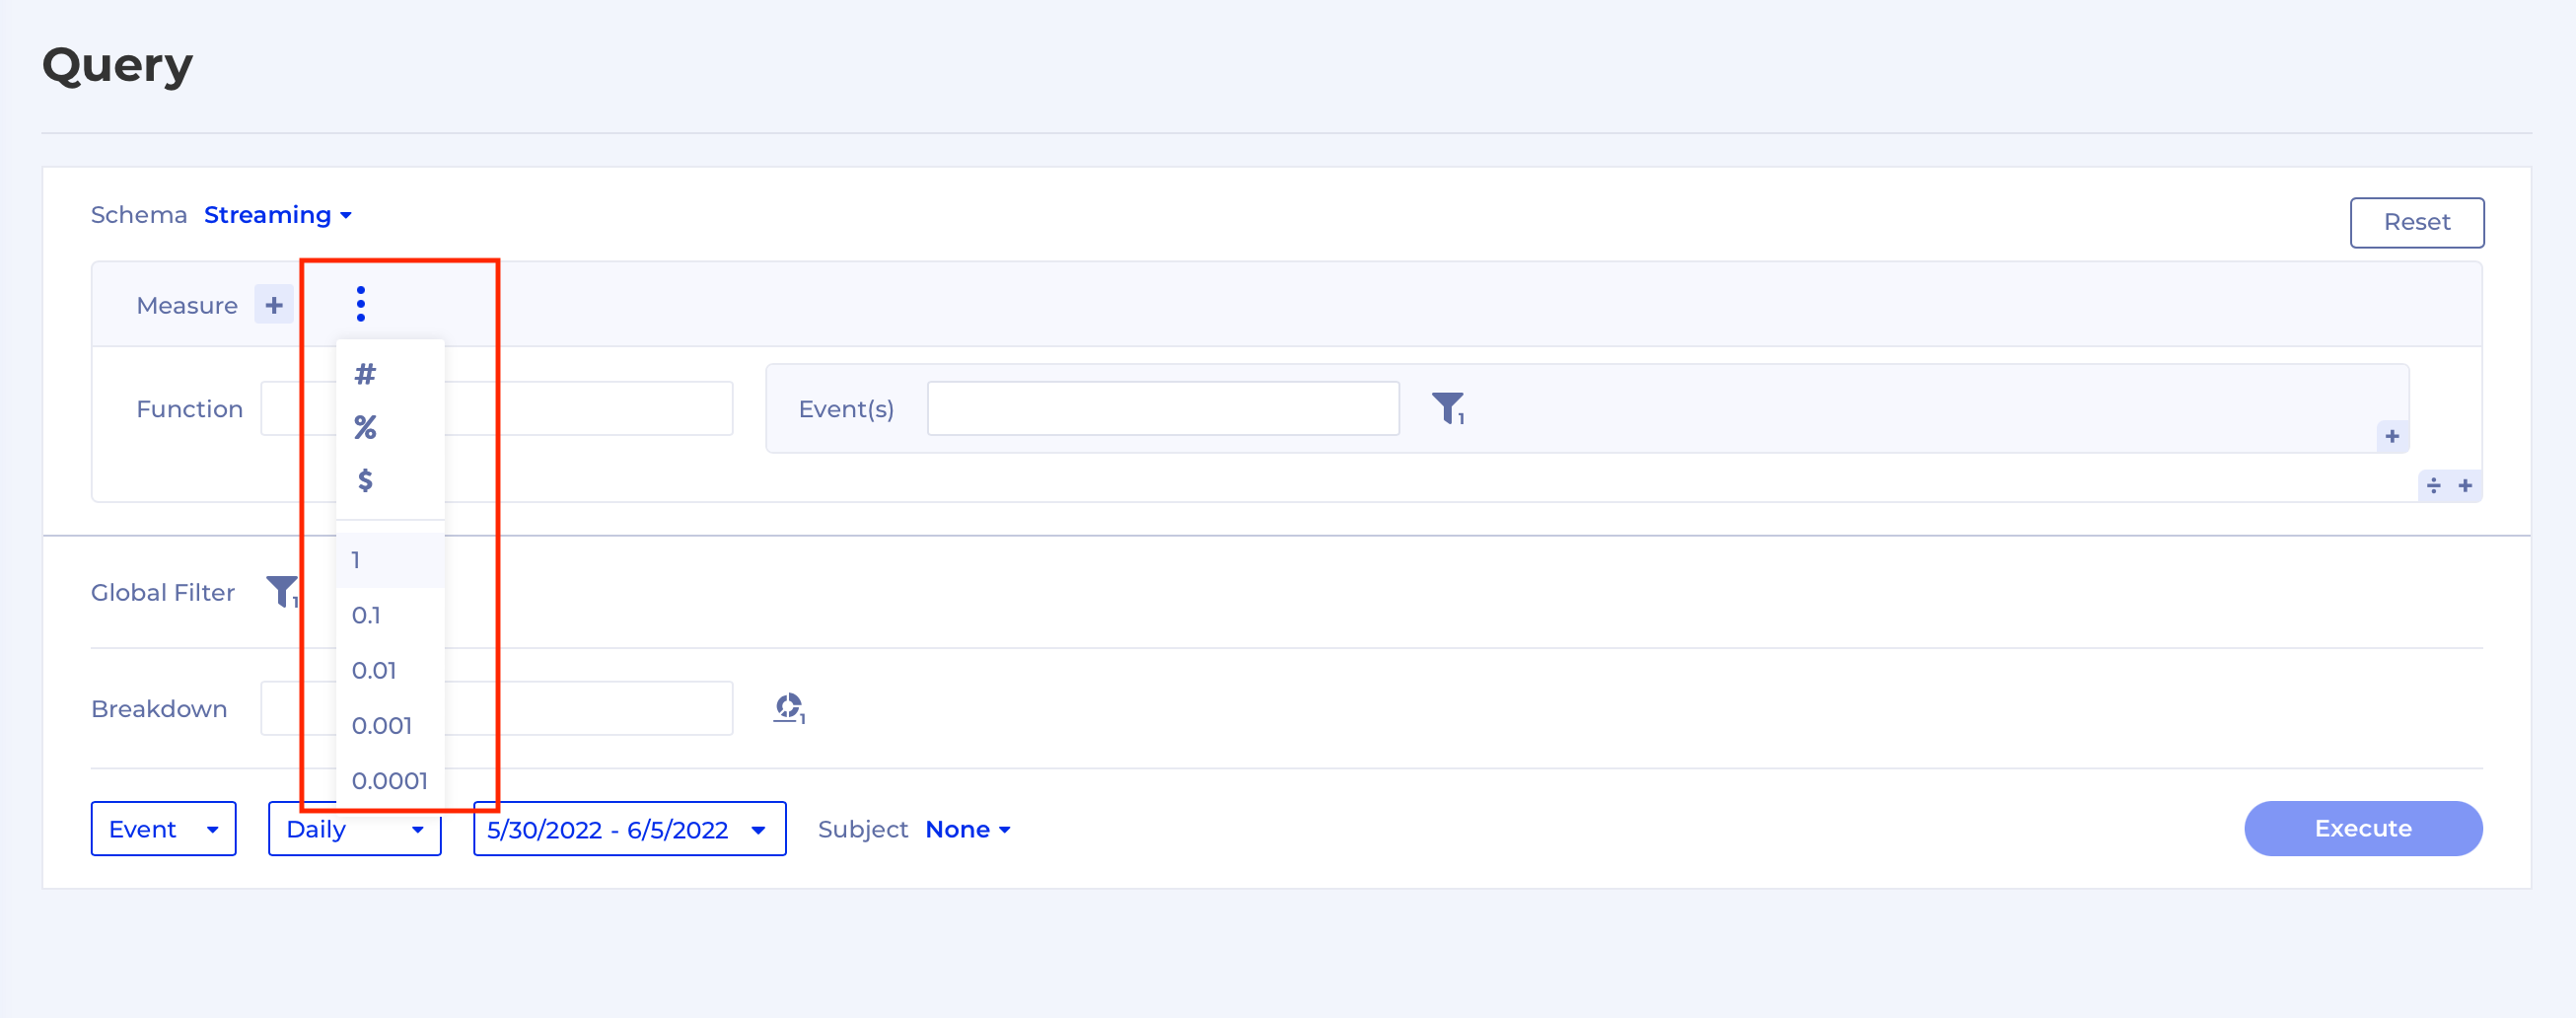
Formatting options in Query builder removed
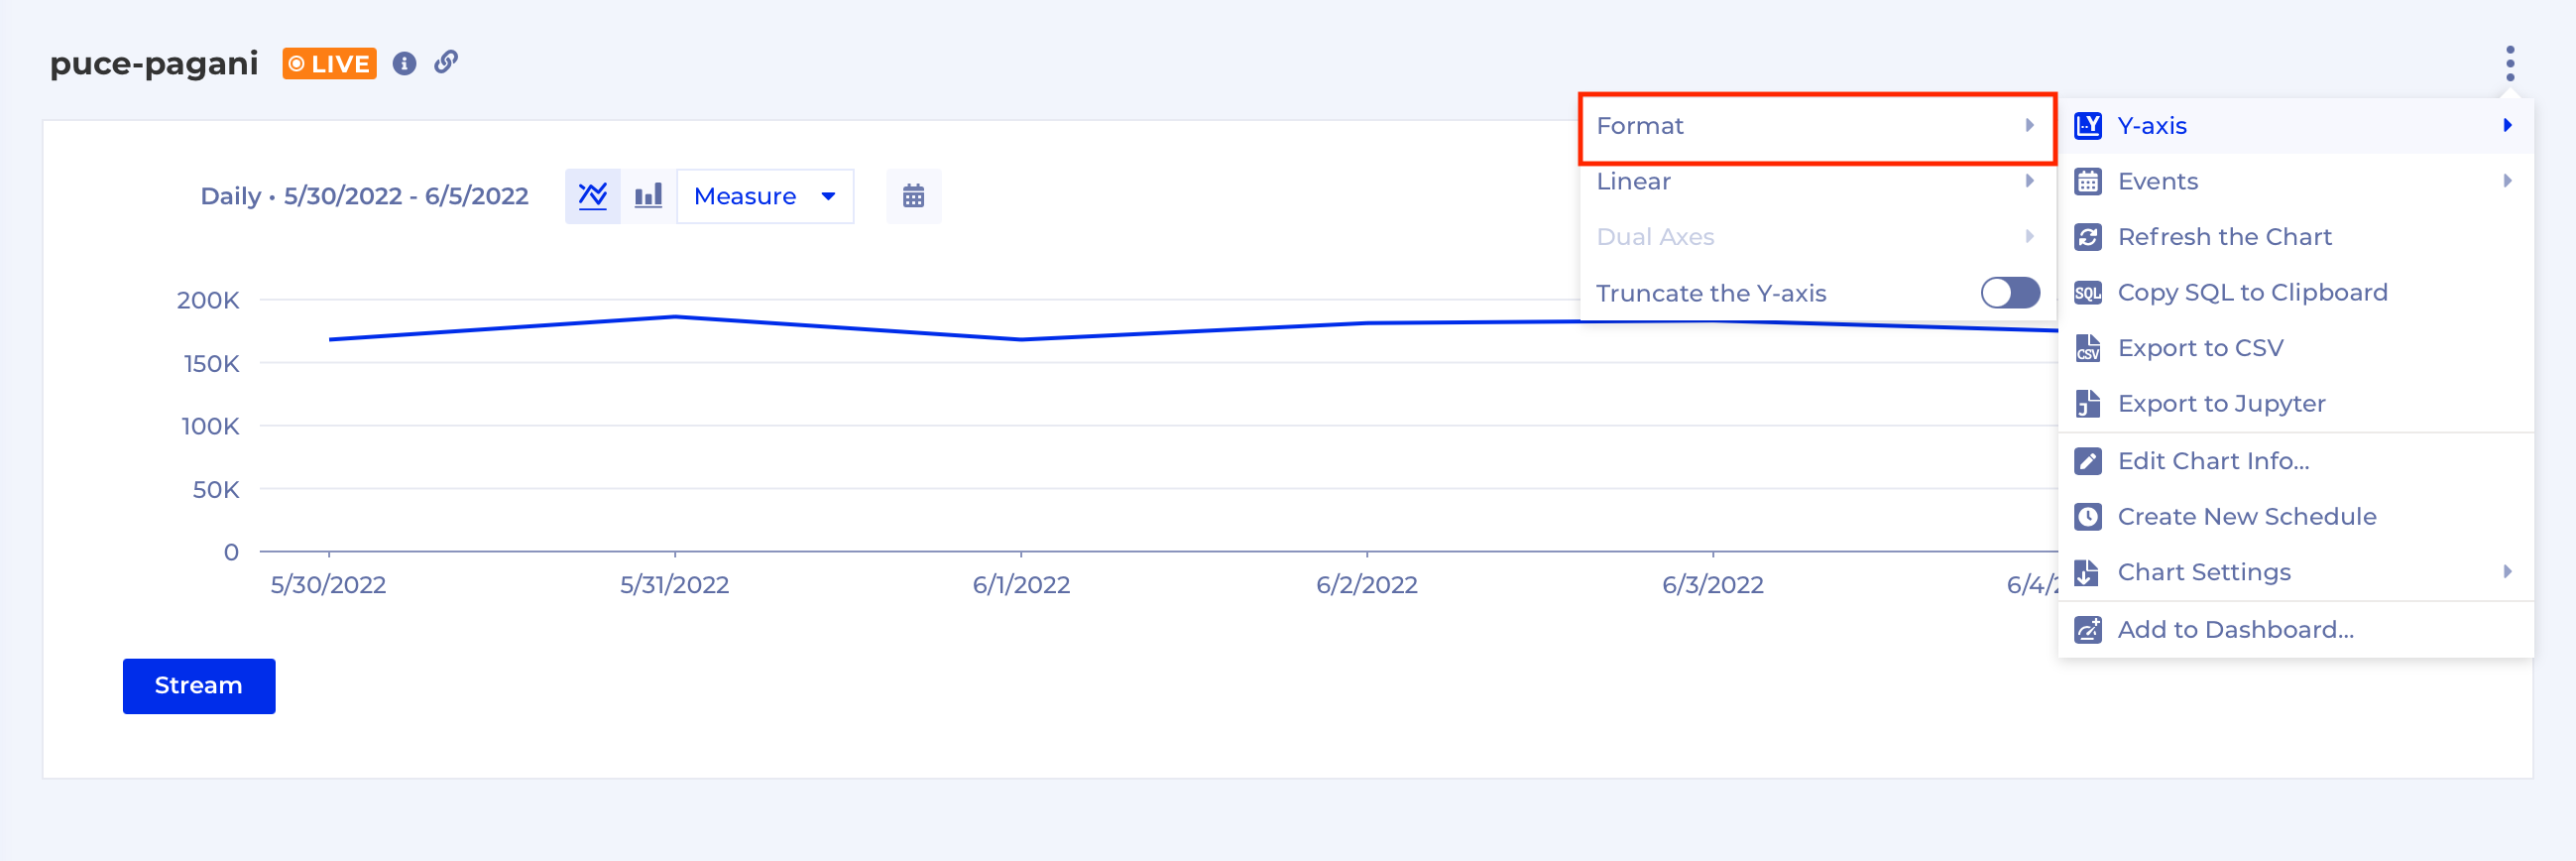
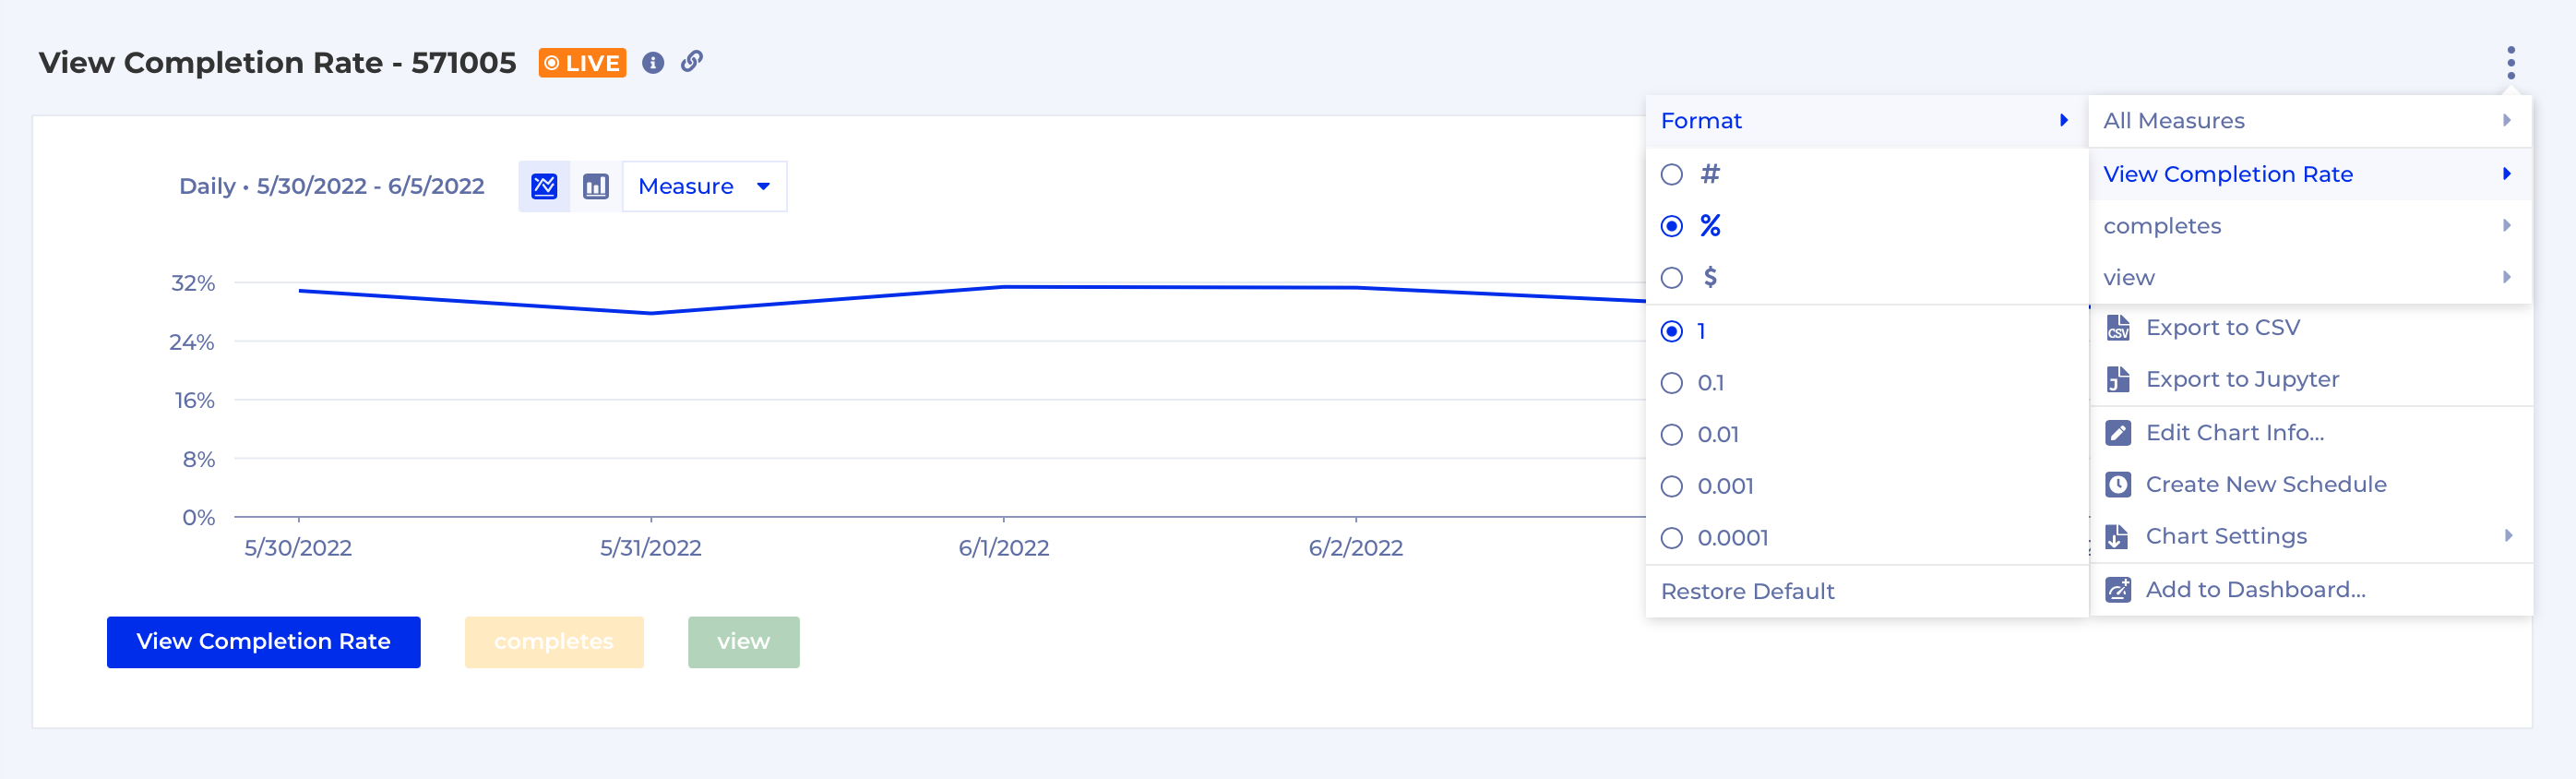
It's more natural to format your Measures after the analysis has been executed and the chart created, therefore we removed the option to specify Measure formatting while building a Query:
You can format all Measures on a chart through the context menu here: