Improved
📊 Funnel Chart - Visual Enhancements
October 2nd, 2025 by Mark Dondanville
We've made enhancements to how Funnel charts display data, making insights easier to interpret and improving overall user experience.
Before: Drop-offs were hard to see when user counts were small, requiring hover interactions to understand patterns.
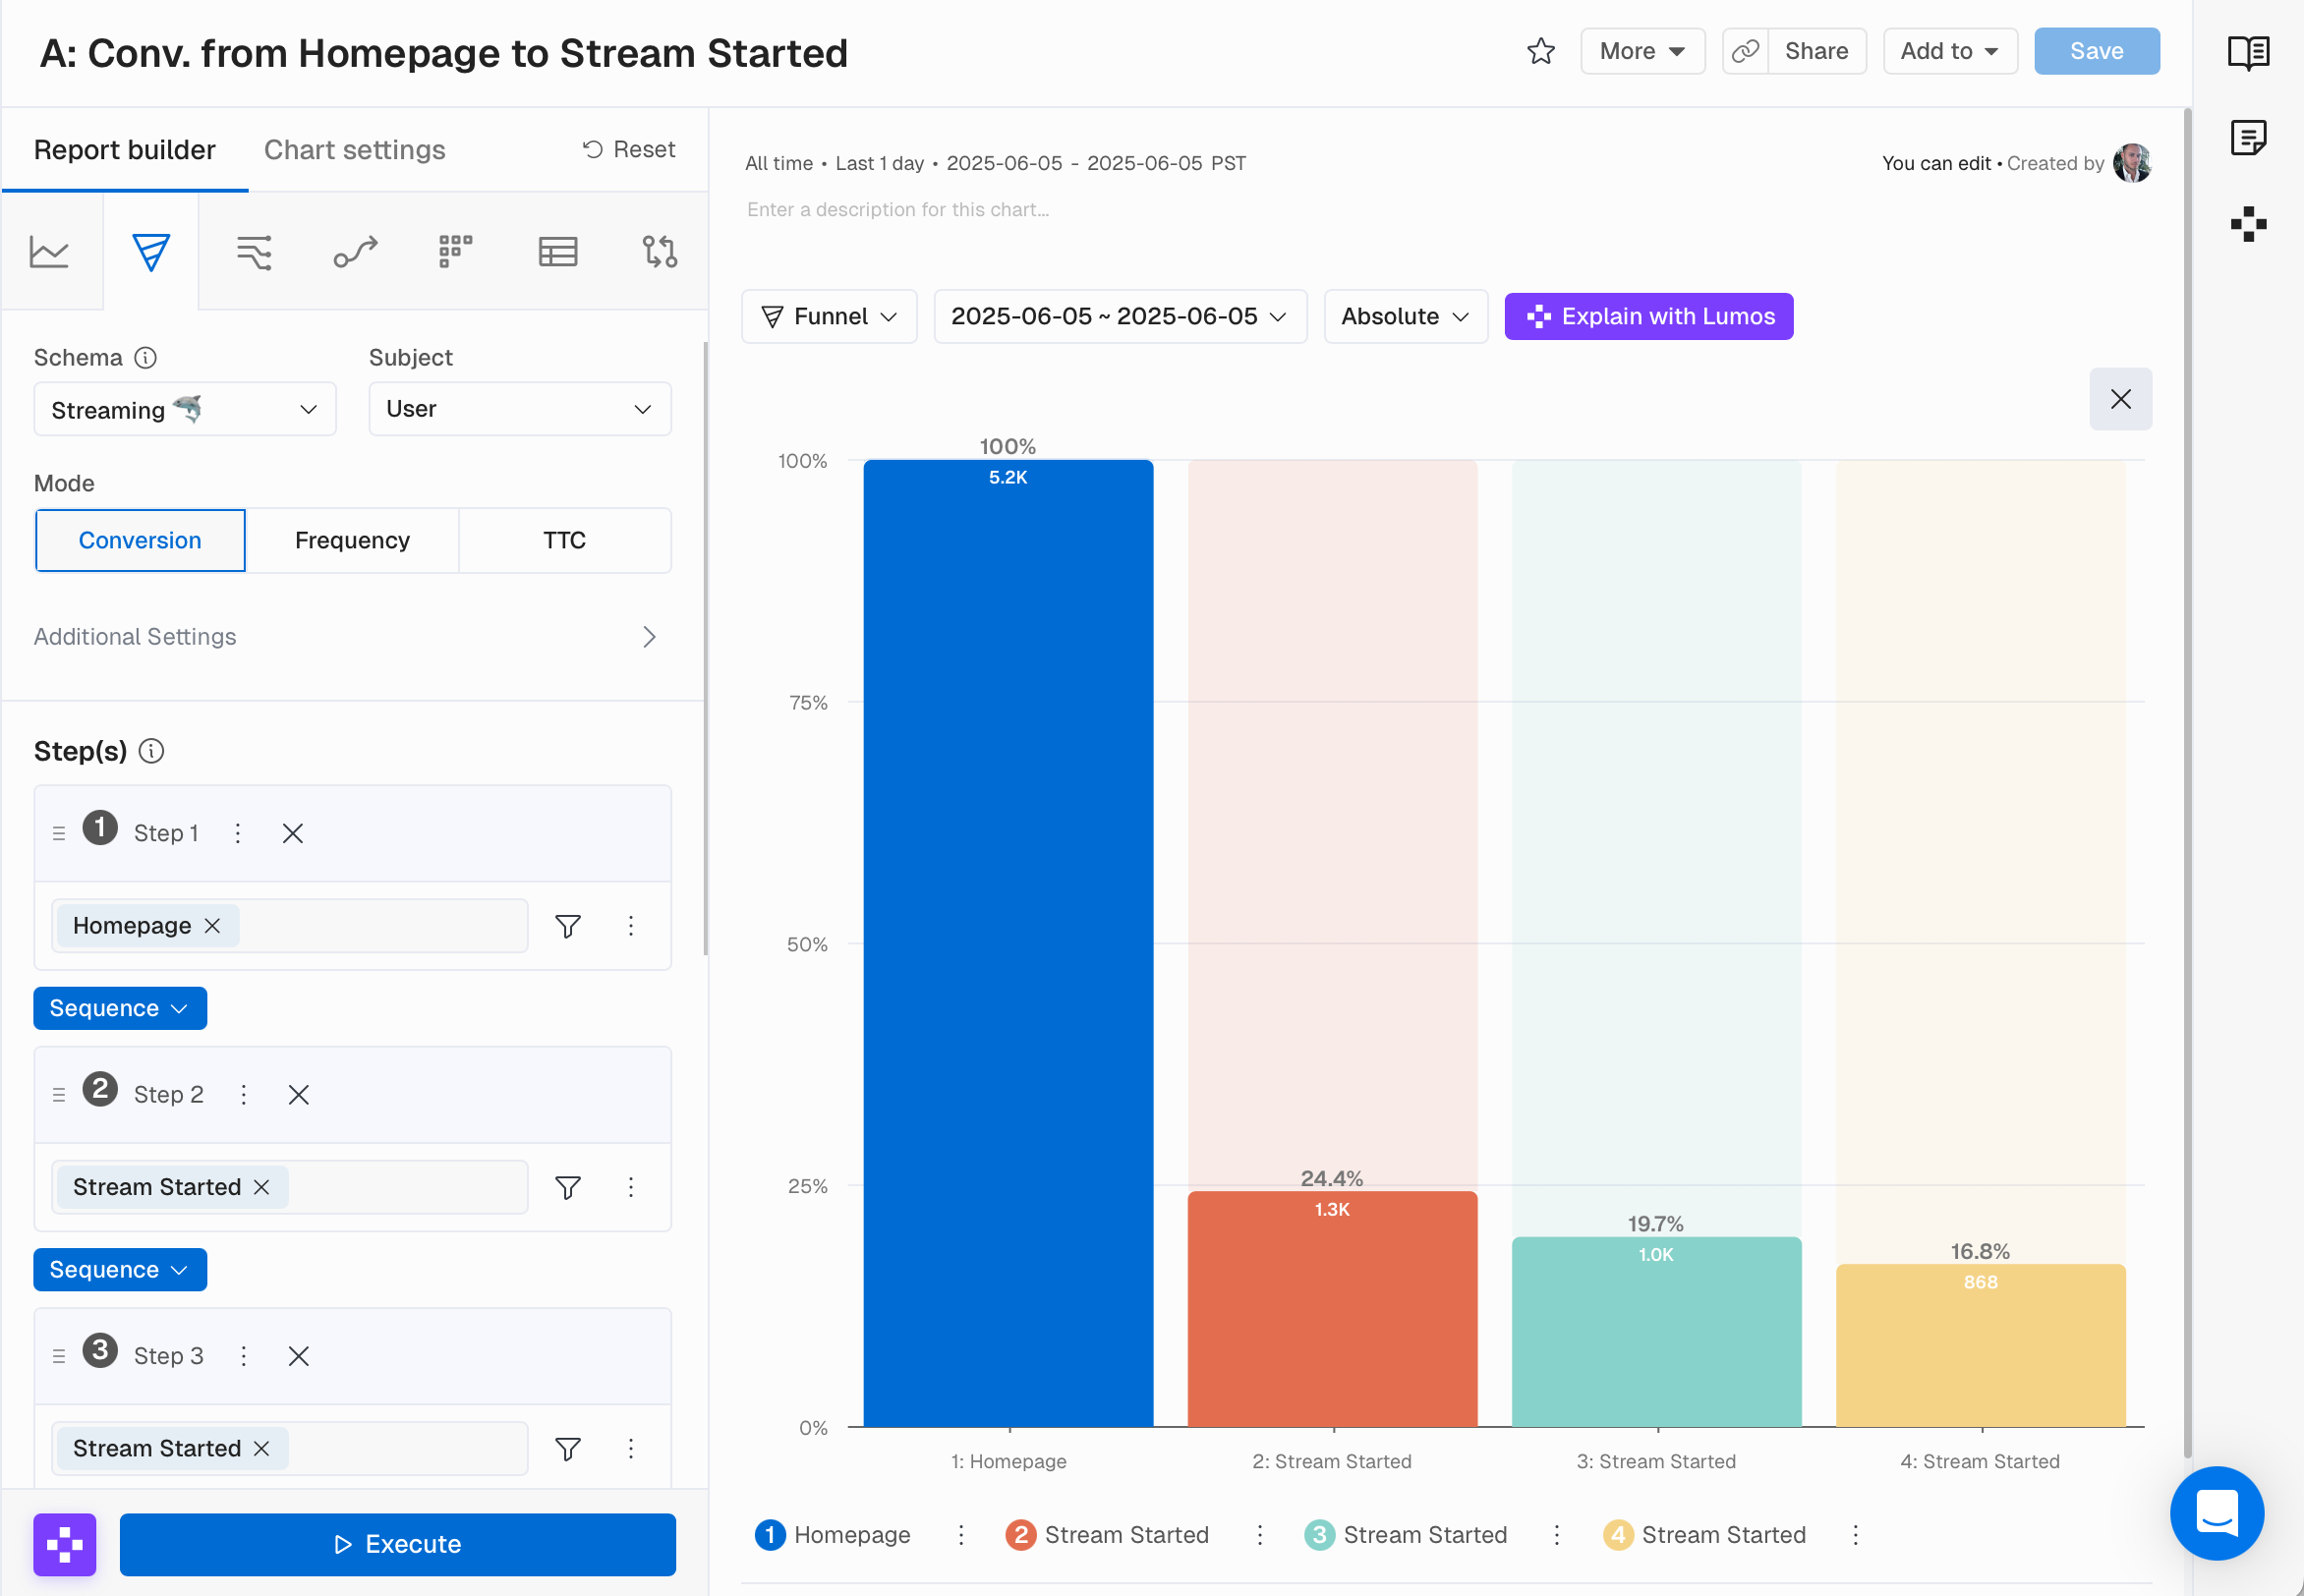
Now: Improved proportional rendering and visual indicators make drop offs visible at a glance, even for small volumes.
The result: Faster identification of problem areas. Reduced analysis time with insights you can see immediately.